
Price Analysis
Bitcoin [BTC], Ethereum [ETH] and Ripple [XRP] Price Analysis, towards new levels
- Bitcoin today surges more than 6% taking it to 5 months high.
- BTC trading at $5814 at the press time.
- Like Bitcoin other Altcoins are also in the green zone.
- Ethereum and Ripple’s XRP also surges but not going the way followed by BTC.
It seems that cryptocurrencies are once again gaining popularity. Today almost all the crypto market rises and are in the green zone. The reason behind this might be the article published by WSJ regarding the Facebook crypto platform. Soon after the news gained popularity the prices start rising.
BTC/USD
Today not only Bitcoin surges more than 6% but also it’s market capitalization crossed $100 Billion. Currently, BTC is trading at $5,814.42 at the press time while it’s market capitalization is $102,800,855,545 as per CoinMarketCap.
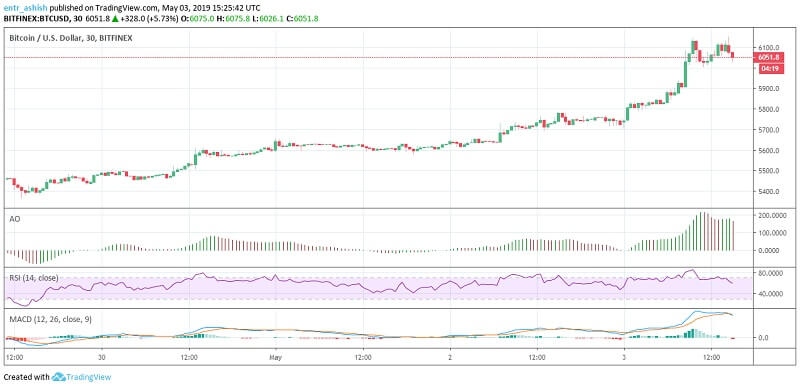
It seems that Bitcoin will reach $6000 in a few days. If the price of Bitcoin rises then it will have resistance at around $5920.
Volume Weighted Moving Average (20) in case of BTC is 5445.7 which is in favorable condition indicating towards buying zone.
While among the Oscillators Relative Strength Index (14) is 77.3 indicating selling pressure.
ETH/USD
Ethereum (ETH) price is also up by about 5% and is currently trading at $169.20 USD. ETH has a strong support at $164 and it seems that it will soon make new resistance level.
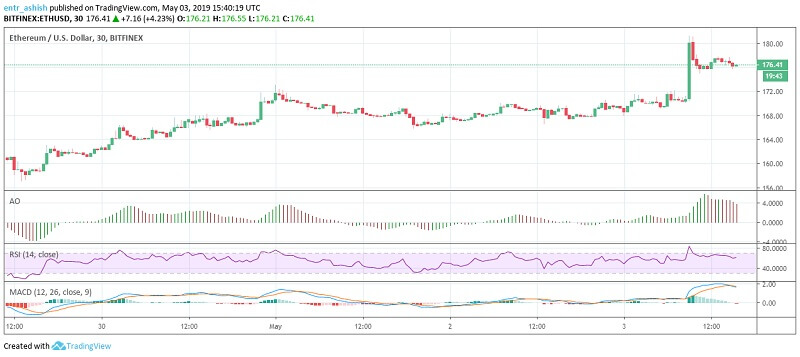
After looking at the Ethereum price chart it can be concluded that Moving averages are in the favour of ETH while Oscillators are in the neutral zone.
Hull Moving Average (9) on a daily basis for Ethereum is 173.06 indicating towards a buying zone. Not only this almost all other moving averages are in favour of Ethereum.
Stochastic RSI Fast (3, 3, 14, 14) for ETH is 72.31 and is in the neutral zone.
XRP/USD
Ripple’s XRP finally started to show its move but the move is not that much promising. It has enjoyed a strong support level of $0.30 for a long time. At the press time, XRP is trading at $0.31 with a rise of 2.10% in the price from the last 24 hour.
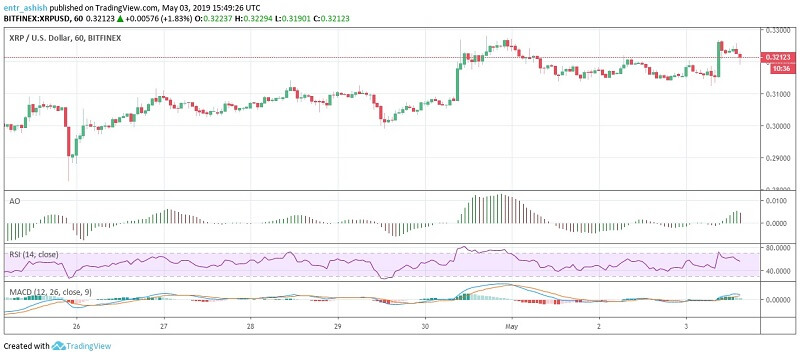
The market capitalization of XRP at the press time is $13,024,071,002 and is maintaining its 3rd spot from a long time.
The upside target for XRP is $0.34 if the bull run continues otherwise it will come to the previous level. Let’s have a look at the XRP price chart.
After looking at the daily moving averages it seems that XRP is in between the buy and sell pressure zone.
MACD Level (12, 26) for XRP on daily basis is −0.00401 indicating a buying zone.
Disclaimer: Koinalert’s content is only for information purpose in nature and should not be considered as investment advice. Do your own market research before investing in any cryptocurrencies. The author or publication does not hold any responsibility for your personal financial loss.


iGaming Platform BC.GAME Signs $40 Million Deal to Become Principal Partner of Leicester City

Coinbase faces new lawsuit that claims SOL, MATIC, NEAR, MANA, ALGO, UNI, XTZ and XLM are securities

Service Beyond Gaming: The Support Experience at HugeWin

Bitcoin (BTC) Cycle: Aiming for $155,000 Peak by August 2025
