
Price Analysis
Ripple [XRP] Price Prediction, Technical Analysis – October 16th

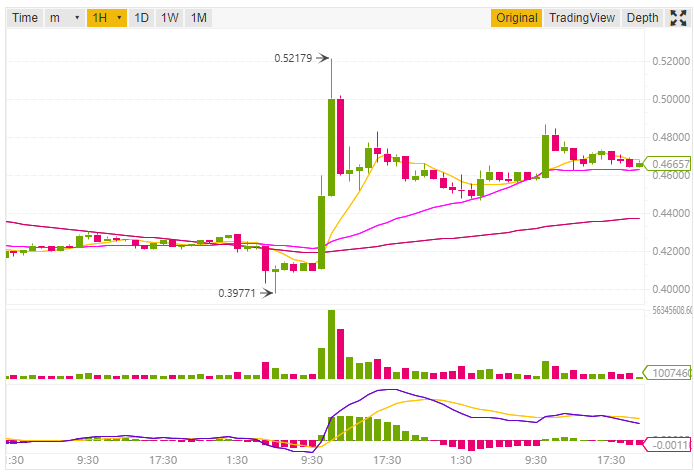
Ripple XRP price surges yesterday and brokes the resistance level of $0.40 and $0.42. Currently trading at $0.453686 USD (+2.28%) against XRP/USD trading pair as per CoinMarketCap.
The market capitalization of Ripple XRP while writing this post is $18,146,351,210 USD. XRP is likely to back in the bullish move. Below I will do the analysis based on the graphs and technical details like EMA, SMA, RSI, MACD Level etc.
Ripple Price Analysis
Yesterday Ripple XRP was in a massive bullish move that helped it to get out of the resistance level of $0.40. Today the support level seems to be around $0.45 and still, there are chances for the upward trend.
However, the upward trend of Ripple was not able to break the daily EMA (200) and SMA (200). The EMA (200) and SMA (200) are 0.50492 and 0.51931 respectively.
Data as per Binance
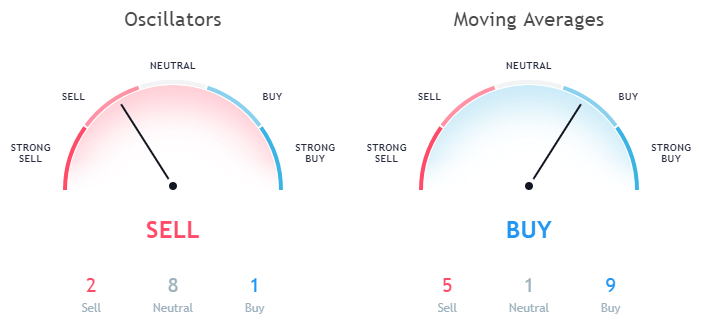
While looking at all other moving averages there is a sign of upward trend against the XRP/USD pair. Almost all the daily moving averages are indicating a massive buy signal.
Ripple XRP is trading above the daily Exponential Moving Average (100) which is a good sign. As per the price graph by Binance it seems that EMA (100) is the new resistance level which is 0.44550.
If XRP will be successful in breaking the price of $0.46 then it will soon break the EMA (200) which is 0.50492. Now let’s have a look at the oscillators to have better clarification on the price trends.
Data as per TradingView
The daily Relative Strength Index (14) for Ripple is 51.60045 and is in the neutral zone. Also, the daily Stochastic RSI Fast (3, 3, 14, 14), Williams Percent Range (14) and Ultimate Oscillator (7, 14, 28) are in the neutral zone with a value of 44.51535, -48.20027 and 39.24074 respectively.
Conclusion
After looking at the charts, moving averages and oscillators the new support level of $0.44. Also, the price of Ripple XRP will be in the upward trend as per the analysis. XRP is in a massive bull run for the short term traders too. In the hourly price analysis, all the moving averages and oscillators are in the massive buy zone.
This article should not be considered as an investment advice. Please conduct your own research before investing in any cryptocurrency.
Disclaimer: Koinalert’s content is only for information purpose in nature and should not be considered as investment advice. Do your own market research before investing in any cryptocurrencies. The author or publication does not hold any responsibility for your personal financial loss.


iGaming Platform BC.GAME Signs $40 Million Deal to Become Principal Partner of Leicester City

Coinbase faces new lawsuit that claims SOL, MATIC, NEAR, MANA, ALGO, UNI, XTZ and XLM are securities

Service Beyond Gaming: The Support Experience at HugeWin

Bitcoin (BTC) Cycle: Aiming for $155,000 Peak by August 2025
