
Price Analysis
Ripple XRP/USD Price Prediction, Technical Analysis – April 17th

Ripple XRP is currently at the 3rd spot in terms of market capitalization. The current market capitalization of XRP is $13,559,681,475 USD while the market cap of Ethereum (ETH) is $17,548,876,984 USD at the time of writing this post. So it seems that XRP still has to struggle to get the 2nd spot.
In terms of volume, ZBG stood first as 13.19% of the volume is traded on this crypto exchange in the XRP/USDT pair. ZB.com and Fatbtc are at the 2nd and 3rd place with a volume of 6.48% and 4.26% respectively in the XRP/BTC pair. Data provided here is as per CoinMarketCap.
Ripple XRP/USD Price Analysis
At the time of writing this analysis, Ripple XRP is trading at $0.328817 USD (2.49%). Let’s start the price analysis based on the technicals like Oscillators and Moving Averages.
While looking at the moving averages the daily Exponential Moving Average (5) and Simple Moving Average (5) are 0.32743 and 0.32640 respectively. Here both the EMA (5) and SMA (5) are indicating towards sell.
Not only this all other EMA (10, 20, 30, 50) and SMA (10, 20, 30, 50) are in the sell zone. So, after looking at the moving averages it can be concluded that XRP is under a massive sell pressure zone.
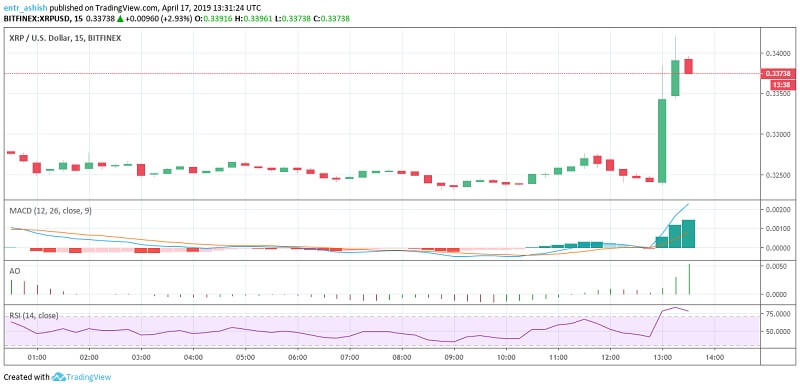
Let’s have a look at the Oscillators so that there will be a clear understanding of the price pattern. The daily Relative Strength Index (14) for XRP is 46.27333 which is currently in the neutral zone. The daily Stochastic %K (14, 3, 3) is also in the neutral zone with a value of 16.31325 while the Awesome Oscillator is −0.00162 and in the sell pressure zone.
The MACD Level (12, 26) is 0.00075 and is in the sell zone. Let’s also have a quick look at the hourly Moving Averages and Oscillators.
In the hourly XRP price chart the EMA (5, 10, 20, 30, 50, 100, 200) and SMA (5, 10, 20, 30, 50, 100, 200 ) all are in the buy zone. Here all the hourly moving averages are in the massive buy zone.
Looking at the hourly Oscillators the RSI (14) is in the sell zone. Stochastic %K (14, 3, 3) and Average Directional Index (14) are in the neutral zone. While the MACD Level (12, 26) is 0.00124 and is in the buy zone.
Conclusion
After looking at the price analysis based on the daily and hourly Moving averages and Oscillators it can be concluded that Ripple XRP will soon show a breakout. A slight drop in price might be seen if the price resists at $0.33 for a longer time.
This article should not be considered as investment advice. Please conduct your own research before investing in any cryptocurrency.
Disclaimer: Koinalert’s content is only for information purpose in nature and should not be considered as investment advice. Do your own market research before investing in any cryptocurrencies. The author or publication does not hold any responsibility for your personal financial loss.


iGaming Platform BC.GAME Signs $40 Million Deal to Become Principal Partner of Leicester City

Coinbase faces new lawsuit that claims SOL, MATIC, NEAR, MANA, ALGO, UNI, XTZ and XLM are securities

Service Beyond Gaming: The Support Experience at HugeWin

Bitcoin (BTC) Cycle: Aiming for $155,000 Peak by August 2025
