
Price Analysis
Bitcoin, Ethereum, Ripple and Bitcoin Cash Price Prediction, Technical Analysis – November 8th

Recently we have witnessed a steady and significant rally in some of the major Altcoins. XRP & BCH are prominent among them. Other Altcoins have also gained some ground. As of now all those crypto’s are in retracement/correction mode and technically all is well. Let’s do some detailed analysis of Top4 Crypto’s.
BTC/USD
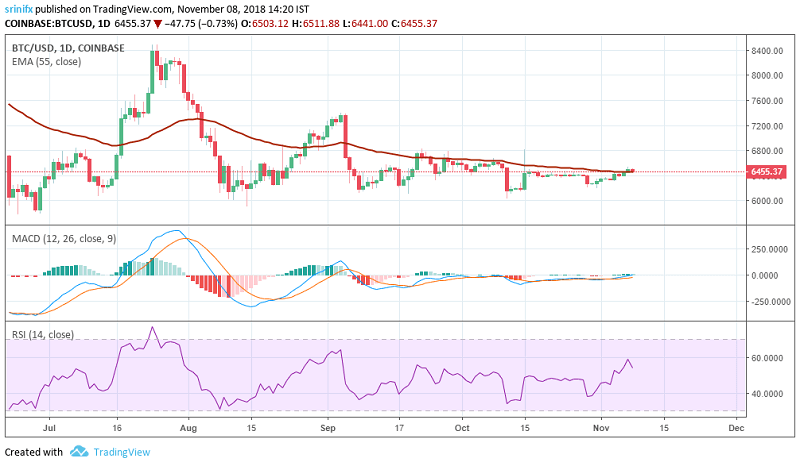
At the time of writing this article, Bitcoin is trading around $6455, a slight retracement from overnight highs of $6505. Until the price stays above $6400, Next trading range will be $6450-$6600 area.
Daily volumes are holding the levels of $4B, which is slightly positive for the price to move higher.
Price chart by TradingView
Bitcoin Technical Analysis
Based on Bitcoin BTC/USD daily chart, the price is just on the critical level of 55Day EMA, MACD is just on the Signal Line and RSI is showing slight strength at 55 Levels. This indicates a slightly positive bias; As Price is far below from 200Day EMA indicating bearish trend intact.
Bitcoin Prediction (Short to Medium term)
As long as Bitcoin Price holds $6400 level and doesn’t break above $6600, we can expect consolidation in the trading ranges $6450-$6600 Area.
ETH/USD
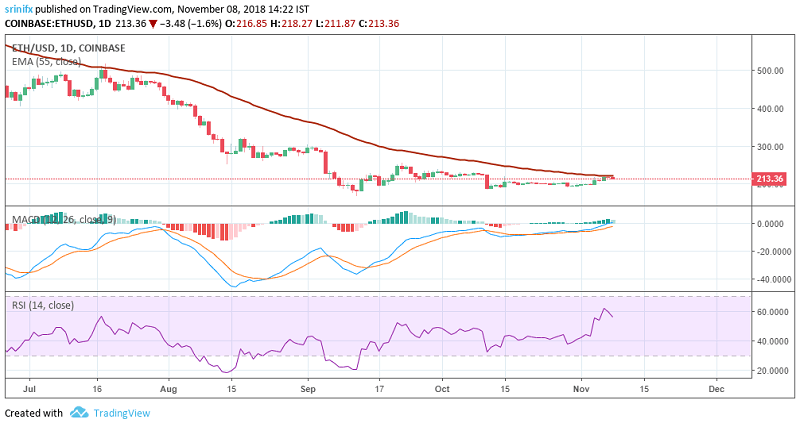
At the time of writing this article, ETH/USD is trading around $215, a slight retracement from overnight highs of $230. Until the price stays above $200, Next trading range will be $210-$225 area. If there is a sudden price breakout above $225 and stays above it we can expect a Rally towards $250.
Daily volumes are holding the levels of $1.5B, which is slightly positive for the price to move higher.
Price Chart by TradingView
Ethereum Technical Analysis
Based on Ethereum ETC/USD daily chart, the price is just on the critical level of 55Day EMA, MACD is just on the Signal Line and RSI is showing strength at 58 Level. This indicates a slightly positive bias; As the Price is far below from 200Day EMA indicating bearish trend intact.
Ethereum Prediction (Short to Medium term)
As long as Ethereum Price holds $200 and breaks above $225, we can expect a quick rally towards $250 Area or else consolidations in the trading range $210-$225 Area.
XRP/USD
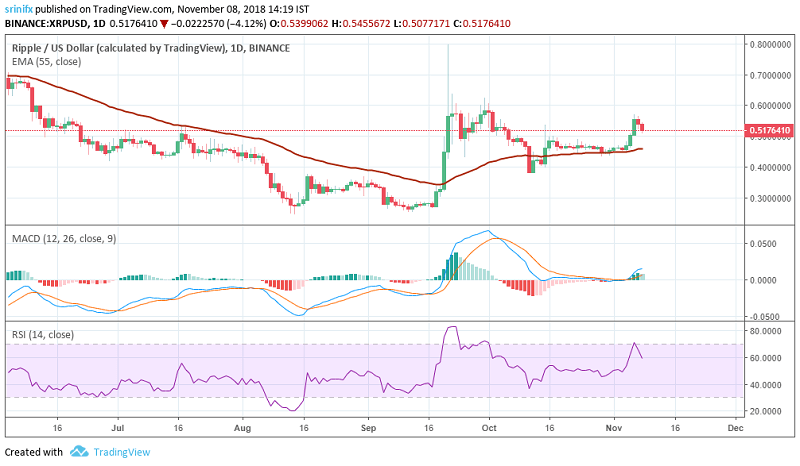
At the time of writing this article, Ripple-XRP is trading at $0.5165. As stated in my earlier article, there was a sudden price breakout above $0.49 and XRP price entered Next trading range of $0.52-$0.56 area. Next support level would be $0.51 to $0.52 area where we can see some buying and next minor resistance level to watch is $0.55 where we can expect some selling.
Price Chart by TradingView
Ripple Technical Analysis
Based on Ripple XRP/USD daily chart, price managed to stay above an important level of 55Day EMA and breached 200DMA successfully with volume and trying to bounce back on it this retracement, MACD is above the Signal Line making a green cross and RSI is now at 60, after retracing from oversold 70Levels. This indicates goo positive bias, Daily volumes decreased, but holding the levels above $500m which supports the above trading bias.
Ripple Prediction (Short to Medium term)
As long as Ripple Price holds $0.4950 and breaks above $0.52, we can expect a quick rally towards $0.55 to $0.56 Area
BCH/USD
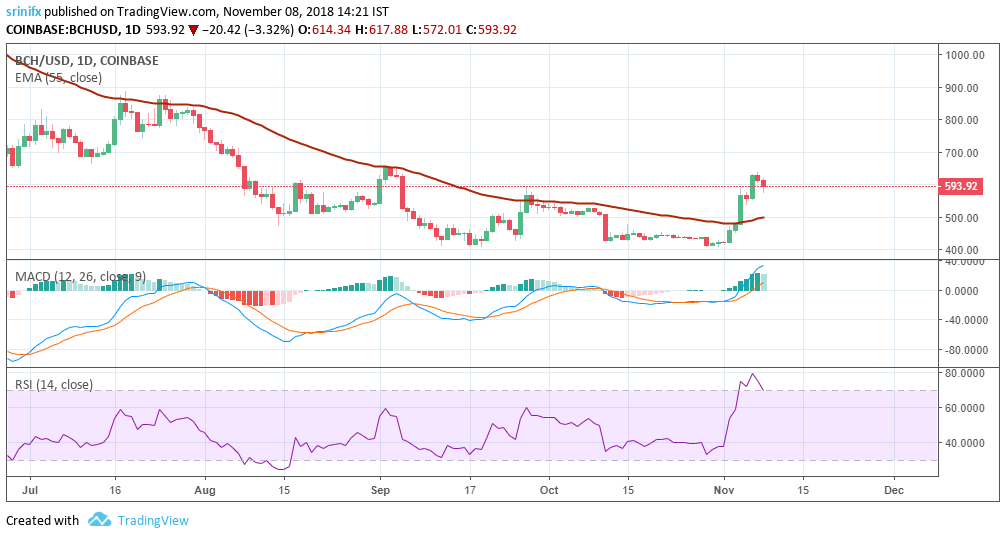
At the time of writing this article, Bitcoin Cash BCH/USD is trading at $590, a good retracement from overnight highs of $625 levels. As long as the price stays above $565, Next trading range will be $560-$600 area. If there is a sudden price breakout above $610 and stays above it, we can see $650 price levels easily
Price Chart by TradingView
Daily volumes are holding the levels $900m and increasing, which is a positive sign for the price to move higher.
Bitcoin Cash Technical Analysis
Based on Bitcoin Cash BCH/USD daily chart, the price is well above the critical level of 55Day EMA, MACD crossed the Signal Line showing good strength along with (MACD histogram in green) and RSI is at 68 is still showing signs of bullishness after retracing from oversold levels of 80 levels. All the indicators indicate a very positive to bullish bias;
Bitcoin Cash Prediction (Short to Medium term)
As long as Bitcoin Cash Price holds $565 and breaks above $600, we can expect a quick rally towards $625-$650 Area or else consolidations in the trading range $560-$600 levels.
Credits:- Srinivas Podila
This article should not be considered as an investment advice. Please conduct your own research before investing in any cryptocurrency.
Disclaimer: Koinalert’s content is only for information purpose in nature and should not be considered as investment advice. Do your own market research before investing in any cryptocurrencies. The author or publication does not hold any responsibility for your personal financial loss.


iGaming Platform BC.GAME Signs $40 Million Deal to Become Principal Partner of Leicester City

Coinbase faces new lawsuit that claims SOL, MATIC, NEAR, MANA, ALGO, UNI, XTZ and XLM are securities

Service Beyond Gaming: The Support Experience at HugeWin

Bitcoin (BTC) Cycle: Aiming for $155,000 Peak by August 2025
