
Price Analysis
Ripple XRP/USD Price Prediction, Technical Analysis – November 6th
Ripple the 3rd largest cryptocurrency by market capitalization is currently trading at $0.52 USD (+13.73%). At the time of writing this post, the market capitalization of Ripple XRP is $21,232,438,975. The market capitalization of Ethereum at this time is $22,006,229,027 so it seems that soon Ripple is going to take the position of Ethereum (ETH).
Today Ripple surges more than 15% from $0.46 to $0.56. It seems that Ripple is in a massive bullish move with such a huge surge in their price.
Ripple XRP News
At the Global Islamic Economic Summit 2018, Dilip Rao the global head of infrastructure disclosed the company’s plans to expand into the Middle East by establishing an office in Dubai.
“I think the UAE government saying that 50% of all government transactions will be on distributed ledger technology by 2020 is a fantastic way to encourage innovation, to bring Fintechs to your market and then to then build the capability locally to iterate on those solutions that the Fintech bring to you.”
Ripple XRP/USD Price Analysis
I will be doing the analysis on the basis of moving averages and oscillators. With a sudden surge in the price of Ripple XRP, it is now trading above the daily 200 EMA and SMA. The daily EMA (200) is 0.49814 while the daily SMA (200) is 0.50691.
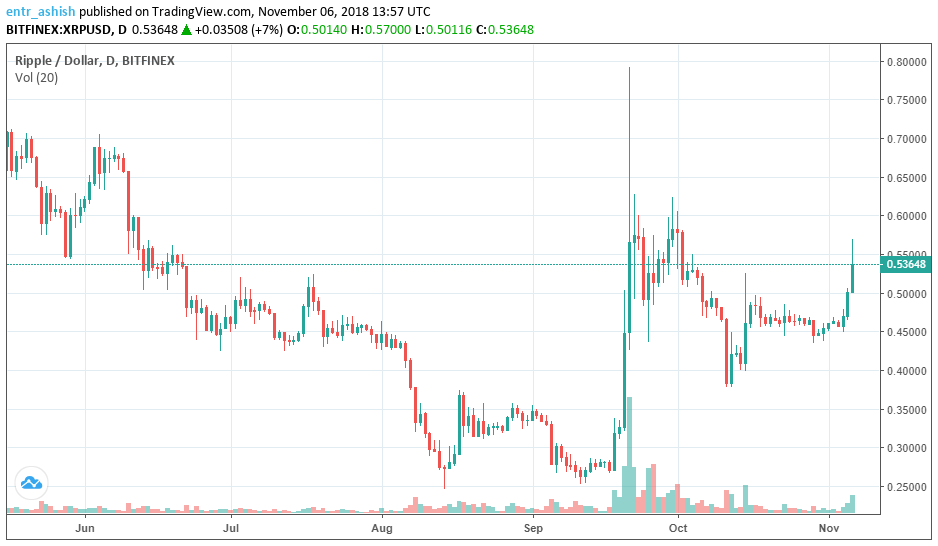
Price Chart as per TradingView
The daily Volume Weighted Moving Average (20) is 0.47788 and is indicating a buy signal. Also, the daily Hull Moving Average (9) is 0.50442 and is indicating a strong buy signal.
Let’s have a look at the Oscillators to have better clarification on the price trends. While looking at the oscillators the daily Relative Strength Index (14) for Ripple XRP is 68.39817 which is between the buy and sell zone.
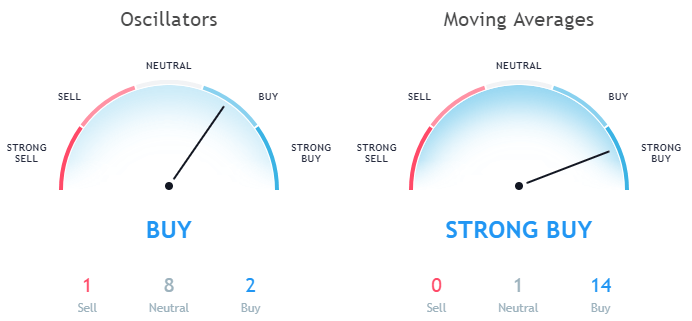
Data as per TradingView
Also, the MACD Level (12, 26) is 0.00836 indicating a buy signal. So after looking at the Moving averages and Oscillators, it is suggesting a strong buying.
Conclusion
After looking at the moving averages and oscillators Ripple XRP seems to go in the upward direction in the coming days. If the price goes below the $0.50 mark then it might further drop to $0.47. In the case of upward movement, it may go high at $0.58
This article should not be considered as an investment advice. Please conduct your own research before investing in any cryptocurrency.
Disclaimer: Koinalert’s content is only for information purpose in nature and should not be considered as investment advice. Do your own market research before investing in any cryptocurrencies. The author or publication does not hold any responsibility for your personal financial loss.


iGaming Platform BC.GAME Signs $40 Million Deal to Become Principal Partner of Leicester City

Coinbase faces new lawsuit that claims SOL, MATIC, NEAR, MANA, ALGO, UNI, XTZ and XLM are securities

Service Beyond Gaming: The Support Experience at HugeWin

Bitcoin (BTC) Cycle: Aiming for $155,000 Peak by August 2025
