
Price Analysis
Ethereum [ETH] and Ripple [XRP] Price Prediction, Technical Analysis – May 16th

- Ethereum [ETH] and Ripple [XRP] both are in the bullish move and is up by more than 14.46% and 3.87% respectively.
- ETH/USD broke its strong resistance which was maintained at $170 USD.
- Both Ethereum and Ripple has gained by 50% within the last 7 days.
- Now there is a race between ETH and XRP for the 2nd place in terms f market capitalization.
Yesterday the price of Ethereum [ETH] surges significantly and reaches the resistance level of $272.10 from $206.55 USD. This was a huge spike in the price of ETH. Currently, ETH and XRP both are up by almost 14.46% and 3.87% respectively within the last 24 hours.
The market capitalization for Ethereum is $27,477,526,159 and that of Ripple’s XRP is $18,820,877,973. As you can see there is still a big gap which XRP have to cover to take the 2nd spot and for this XRP have to remain in the bullish move. There are chances that XRP will surges even more after it reaches the $0.50 USD mark.
Ethereum ETH/USD Price Analysis
As we see yesterday that Ethereum [ETH] crossed its resistance level of $206 against the US Dollar. ETH rises about 20% and even broke the $240 strong resistance and reaches $270 USD level.
Ethereum is currently in the safe zone and trading at $260.35 USD which is more than 12.3% within the last 24 hour at the press time.
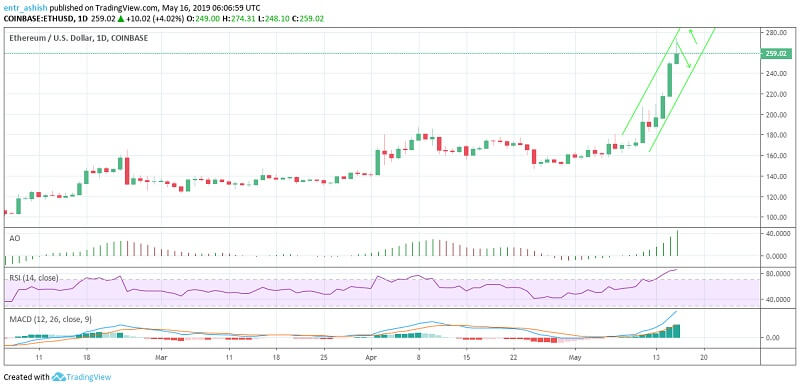
If we see the technical indicators like moving averages and oscillators we can better analyse the price. ETH/USD price has almost crossed the Exponential Moving Average (200) and Simple Moving Average (200) which was 178.35 and 142.37, which is a good sign.
Volume Weighted Moving Average (20) for ETH on daily basis is 191.33 which is indicating a buy signal.
While the Relative Strength Index (14) is 86.04 which is in the trap of sell pressure zone.
MACD Level (12, 26) on daily basis is 18.59 and is indicating a buy signal.
So it seems that moving averages are indicating a buy signal while oscillators are indicating a sell signal.
Ripple XRP/USD Price Analysis
Ripple [XRP] which came into the bull run after Börse Stuttgart which is Germany’s 2nd largest stock market exchange lists XRP and LTC based ETNs. The bull run is still continued which resulted in the price increase of almost 49.5% within the last 7 days.
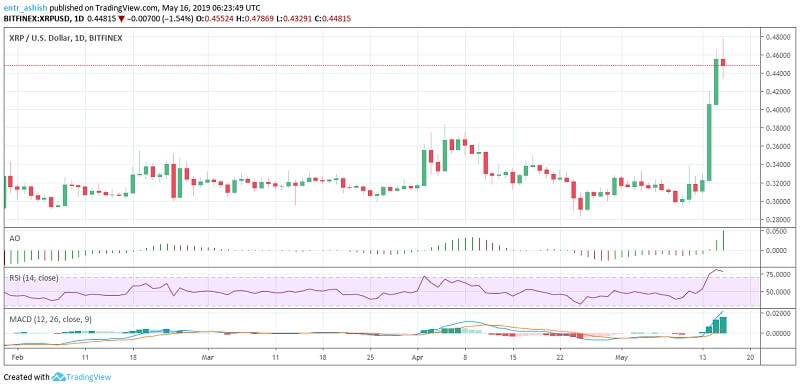
If we look at the Ripple’s XRP daily price chart then it can be concluded that it is indicating towards a buy signal. So I’ll do the analysis on the basis of the hourly price chart.
EMA (5, 10) and SMA (5, 10) both are now in the sell pressure zone, while all other EMA and SMA are in the buy zone.
Hull Moving Average (9) for XRP on an hourly basis is 0.44423 which is a good sign.
Relative Strength Index (14) is in between the selling and buying pressure zone.
MACD Level (12, 26) is 0.01097 and is in the selling pressure zone.
Conclusion
The next resistance level for XRP/USD is $0.47, $0.48 and $0.50 while the support levels are $0.43, $0.41 and $0.39 USD.
The next resistance level for ETH/USD is $285 while the support level is $252.
This article should not be considered as investment advice. Please conduct your own research before investing in any cryptocurrency.
Disclaimer: Koinalert’s content is only for information purpose in nature and should not be considered as investment advice. Do your own market research before investing in any cryptocurrencies. The author or publication does not hold any responsibility for your personal financial loss.


iGaming Platform BC.GAME Signs $40 Million Deal to Become Principal Partner of Leicester City

Coinbase faces new lawsuit that claims SOL, MATIC, NEAR, MANA, ALGO, UNI, XTZ and XLM are securities

Service Beyond Gaming: The Support Experience at HugeWin

Bitcoin (BTC) Cycle: Aiming for $155,000 Peak by August 2025
