
Price Analysis
Ripple [XRP] Price Prediction, Technical Analysis – October 8th

Ripple XRP is the 3rd largest cryptocurrencies by Market Capitalization is currently trading at $0.484713 USD (+1.80%) according to CoinMarketCap at the time of writing this post. The 24h High for this cryptocurrency is $0.49655 and 24h Low is $0.47111 (As per Binance XRP/USDT pair). The market capitalization for Ripple XRP while writing this post is $19,357,224,950 USD (CoinMarketCap).
Ripple Price Prediction and Technical Analysis
We will do the analysis in two parts, the first will be based on 1-day price forecast while the other will be 1h price forecast.
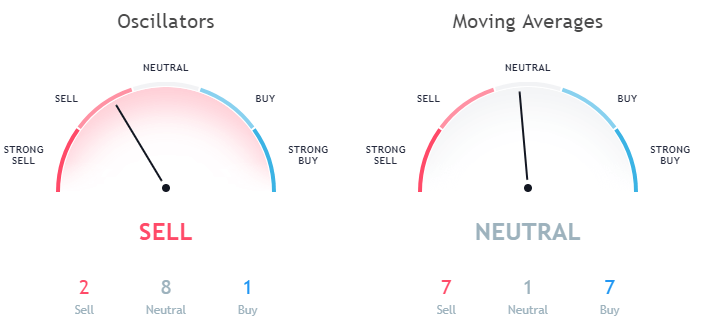
1-day Price Forecast
We will do the analysis based on Moving Averages and Oscillators. So let’s start with the moving averages the Exponential Moving Average (10) for XRP is 0.50902 while the Simple Moving Average (10) is 0.52852. Here EMA (10), as well as SMA (10), is indicating a sell signal. EMA (20, 30, 50, 100) and SMA (30, 50, 100) is in the buy zone.
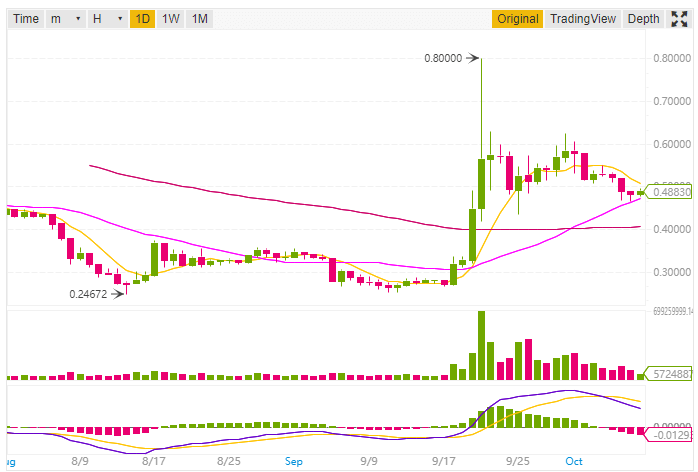
Data as per Binance
Also, the Volume Weighted Moving Average (20) which is 0.53079 is in the sell zone. The Hull Moving Average (9) is 0.47749 which is indicating a buy signal. Here you can notice that most of the moving averages are indicating a buy signal.
Data as per TradingView
While looking at the Oscillators the Relative Strength Index (14) is 53.40565 which is in the Neutral Zone and the MACD Level (12, 27) is 0.03395 and recommending selling. Momentum (10) is in the sell zone having a value of -0.05057.
The Bull Bear Power for XRP is -0.03814 which is in the buy zone.
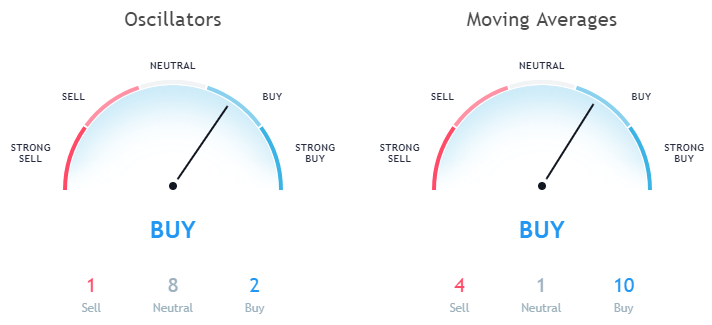
1h Price Forecast
Now let’s discuss the price forecast based on 1-hour price graph. While looking at the Moving Averages of 1h price graph the Exponential Moving Average (10) is 0.48590 and Simple Moving Average (10) is 0.48595. Here both the EMA (10) and SMA (10) is indicating a buy signal.
Data as per TradingView
EMA (20) and SMA (20) is indicating towards a buy signal. The moving average which is in the neutral zone is Ichimoku Cloud Base Line (9, 26, 52, 26) having a value of 0.48188.
Also, while looking at the Oscillators the Relative Strength Index (14) in the 1h forecast is 62.26170 which is in the neutral zone. The MACD level (12, 27) is 0.00146 indicating a buy signal. The Awesome Oscillator having a value of 0.00531 is in the buy zone.
This article should not be considered as an investment advice. Please conduct your own research before investing in any cryptocurrency.
Disclaimer: Koinalert’s content is only for information purpose in nature and should not be considered as investment advice. Do your own market research before investing in any cryptocurrencies. The author or publication does not hold any responsibility for your personal financial loss.


iGaming Platform BC.GAME Signs $40 Million Deal to Become Principal Partner of Leicester City

Coinbase faces new lawsuit that claims SOL, MATIC, NEAR, MANA, ALGO, UNI, XTZ and XLM are securities

Service Beyond Gaming: The Support Experience at HugeWin

Bitcoin (BTC) Cycle: Aiming for $155,000 Peak by August 2025
