
Price Analysis
Ripple [XRP] Price Prediction, Technical Analysis – October 4th
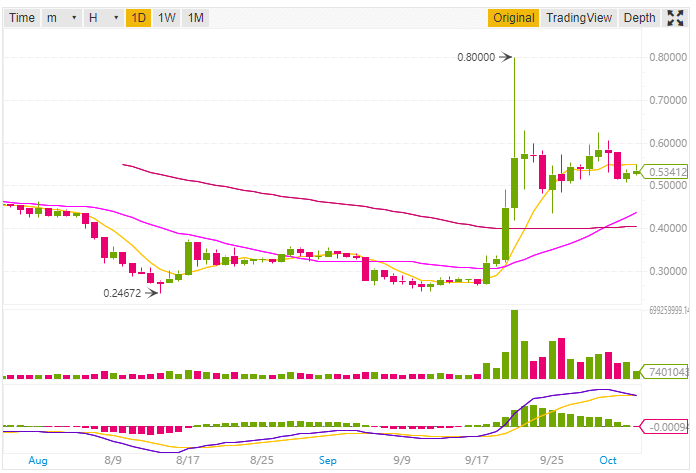
Ripple XRP is the 3rd largest cryptocurrencies by Market Capitalization is currently trading at $0.533004 USD (+0.70%) according to CoinMarketCap at the time of writing this post. The 24h High for this cryptocurrency is $0.54999 and 24h Low is $0.51603 (As per Binance XRP/USDT pair). The market capitalization for Ripple XRP while writing this post is $21,285,742,998 USD (CoinMarketCap).
Today MoneyTap a Ripple-powered payments app launched today by the Japan Bank Consortium. This will offer real-time settlement for domestic payments in Japan.
Money Tap is a new bank experience application provided by the “consortium for domestic and foreign exchange”. Money Tap is an application that realized remittance directly from bank accounts to bank accounts. No charge is required and anyone with a bank account can start it easily.
Ripple Price Prediction and Technical Analysis
We will do the analysis in two parts, the first will be based on 1-day price forecast while the other will be 1h price forecast.
1-day Price Forecast
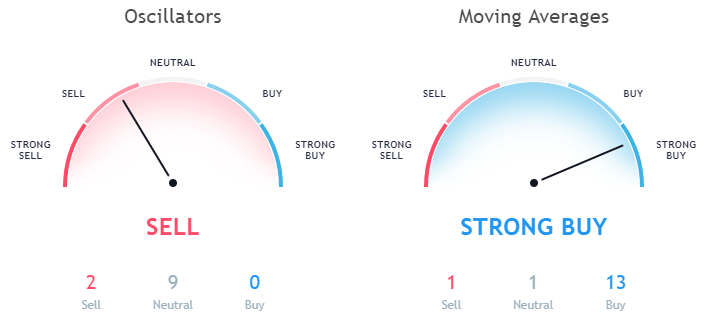
We will do the analysis based on Moving Averages and Oscillators. So let’s start with the moving averages the Exponential Moving Average (10) for XRP is 0.52957 while the Simple Moving Average (10) is 0.54307. Here EMA (10) is indicating a buy signal while SMA (10) is indicating a sell signal. All other moving averages like EMA (20, 30, 50, 100, 200) and SMA (20, 30, 50, 100, 200) is in the buy zone.
Data as per Binance
Also, the Volume Weighted Moving Average (20) which is 0.51861 is in the buy zone. The Hull Moving Average (9) is 0.53172 which is also indicating a buy signal. Here you can notice that all the moving averages are indicating a buy signal. It seems next bull run is on its way.
Data as per TradingView
While looking at the Oscillators the Relative Strength Index (14) is 61.43351 which is in the Neutral Zone and the MACD Level (12, 27) is 0.05523 and recommending selling. Momentum (10) is also in the sell zone having a value of 0.04199.
The Bull Bear Power for XRP is 0.04081 which is in the Neutral zone.
1h Price Forecast
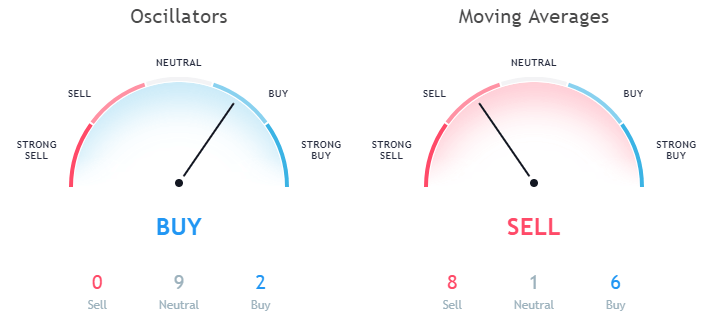
Now let’s discuss the price forecast based on 1-hour price graph. While looking at the Moving Averages of 1h price graph the Exponential Moving Average (10) is 0.53638 and Simple Moving Average (10) is 0.53919. Here both the EMA (10) and SMA (10) is indicating a sell signal.
Data as per TradingView
EMA (20) and SMA (20) is indicating towards a buy signal. The moving average which is in the neutral zone is Ichimoku Cloud Base Line (9, 26, 52, 26) having a value of 0.53294.
Also, while looking at the Oscillators the Relative Strength Index (14) in the 1h forecast is 50.21740 which is in the neutral zone. The MACD level (12, 27) is 0.00140 indicating a buy signal. The Awesome Oscillator having a value of 0.00895 is in the neutral zone.
This article should not be considered as an investment advice. Please conduct your own research before investing in any cryptocurrency.
Disclaimer: Koinalert’s content is only for information purpose in nature and should not be considered as investment advice. Do your own market research before investing in any cryptocurrencies. The author or publication does not hold any responsibility for your personal financial loss.


iGaming Platform BC.GAME Signs $40 Million Deal to Become Principal Partner of Leicester City

Coinbase faces new lawsuit that claims SOL, MATIC, NEAR, MANA, ALGO, UNI, XTZ and XLM are securities

Service Beyond Gaming: The Support Experience at HugeWin

Bitcoin (BTC) Cycle: Aiming for $155,000 Peak by August 2025
