
Price Analysis
Ripple [XRP] Price Prediction, Technical Analysis – October 03rd
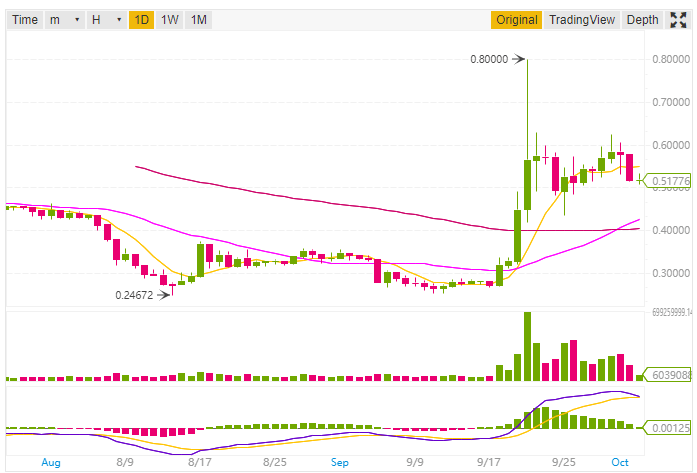
Ripple XRP is currently at the 3rd place in the list of cryptocurrency in terms of Market Capitalization. As per CoinMarketCap, the price of XRP at the time of writing this post is $0.521501 USD (-8.42%) and the market capitalization is $20,826,357,365 USD.
As per Binance, the 24h high for XRP is $0.57107 and 24h low is $0.50785 (Binance XRP/USDT Pair). While Ripple XRP is up -0.15% up from the previous week.
Ripple Price Prediction and Technical Analysis
Ripple XRP seems to be on a massive Bearish move, not only this all other cryptocurrencies are in bearish move. Here I will do the analysis in two parts first one will be on the basis of the 1-day price forecast while the other one will be on 1h price forecast.
1-day Price Forecast
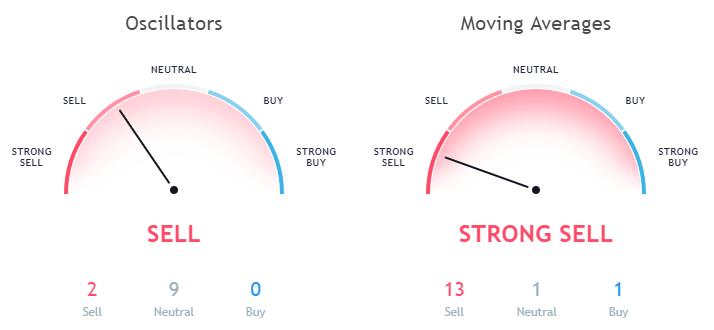
In the 1-day price forecast, the Exponential Moving Average (10) is 0.52645 and Simple Moving Averages is 0.53772 both indicating a sell signal. Let’s have a look at the other Moving averages to have better clarification the price trends. Rest other EMA and SMA like EMA (20, 30, 50, 100) and SMA (20, 30, 50, 100) are in the buy zone.
Data as per Binance
The Hull Moving Average (9) which is 0.54794 is indicating a sell signal. The Ichimoku Cloud Base Line (9, 26, 52, 26) is 0.52172 and is in the neutral zone. So on the basis of moving averages, it can be concluded that XRP is slowly going towards the bearish move.
Data as per TradingView
Let’s have a look at the Oscillators, the Relative Strength Index (14) is 59.41203 and the MACD Level (12, 27) is 0.05745 and is recommending buying. The Average Directional Index (14) is in the Neutral zone having a value of 41.75569 and the Stochastic %K (14, 3, 3) is in the Neutral Zone.
1h Price Forecast
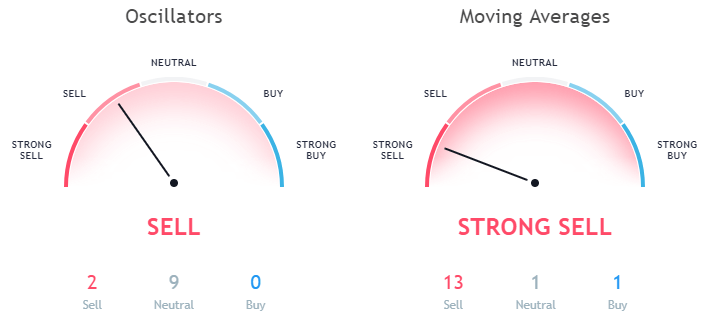
Now let’s have a look at the 1h price forecast. The Exponential Moving Average (10) for Ripple XRP is 0.52577 while the Simple Moving Average (10) is 0.52452. Here both EMA (10) and SMA (10) is indicating a sell signal. Not only this all other moving averages like EMA (20, 30, 50, 100, 200) and SMA (20, 30, 50, 100, 200) are also in the sell zone.
Data as per TradingView
The only moving average under 1h price forecast which is in the buy zone is Hull Moving Average (9) with a value of 0.51627
Even if we look at the Oscillators for 1h price forecast the Relative Strength Index (14) is 31.59873 which is in the neutral zone. The MACD Level (12, 27) is in the sell zone with a value of -0.01256.
Conclusion
As per the analysis based on the different moving averages, graphs and Oscillators Ripple XRP will take some time for a bullish move. The support level seems to be at $0.50, you can HODL it for some time.
This article should not be considered as an investment advice. Please conduct your own research before investing in any cryptocurrency.
Disclaimer: Koinalert’s content is only for information purpose in nature and should not be considered as investment advice. Do your own market research before investing in any cryptocurrencies. The author or publication does not hold any responsibility for your personal financial loss.


iGaming Platform BC.GAME Signs $40 Million Deal to Become Principal Partner of Leicester City

Coinbase faces new lawsuit that claims SOL, MATIC, NEAR, MANA, ALGO, UNI, XTZ and XLM are securities

Service Beyond Gaming: The Support Experience at HugeWin

Bitcoin (BTC) Cycle: Aiming for $155,000 Peak by August 2025
