
Price Analysis
Tron [TRX] Price Prediction, Technical Analysis – October 03rd

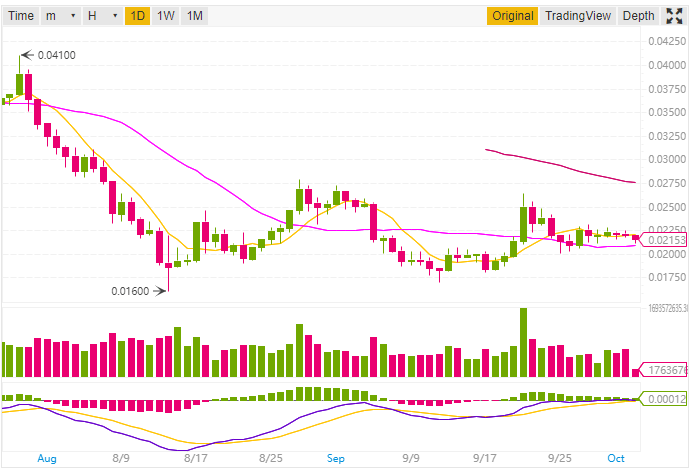
Tron TRX is currently at the 13th place in the list of cryptocurrency in terms of Market Capitalization. As per CoinMarketCap, the price of Tron TRX at the time of writing this post is $0.021562 USD (-3.22%) and the market capitalization is $1,417,677,380 USD.
As per Binance, the 24h high for TRX is $0.02246 and 24h low is $0.02119 (Binance TRX/USDT Pair). While Tron is up 3.36% up from the previous week.
Tron Price Prediction and Technical Analysis
TRON seems to be on a massive Bearish move, not only this all other cryptocurrencies are in bearish move. Here I will do the analysis in two parts first one will be on the basis of the 1-day price forecast while the other one will be on 1h price forecast.
1-day Price Forecast
The 10-day Exponential Moving Average for Tron TRX is 0.021906 while the 10-day Simple Moving Average is 0.021892. Both of the above EMA (10) and SMA (10) is indicating a sell signal. Let’s have a look at the other Moving averages to have better clarification the price trends.
Data as per Binance
The other moving averages like EMA (20, 30, 50, 100, 200) all are in the sell zone. Similar is the case with SMA (50, 100, 200) while the SMA (20, 30) are in the buy zone.
The Volume Weighted Moving Average (20) for TRX is 0.021796 and the Hull Moving Average (9) is 0.022039all indicating a sell signal. So on the basis of moving averages, it can be concluded that TRON is on a massive bearish move.
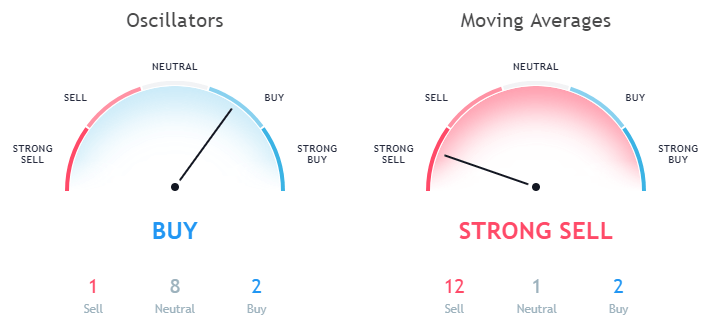
Data as per TradingView
Let’s have a look at the Oscillators, the MACD Level (12, 27) is 0.000008 indicating a buy signal. The Relative Strength Index (14) is 48.580840 which is in the Neutral zone. Also, the Bull Bear Power is -0.000512 indicating a sell signal.
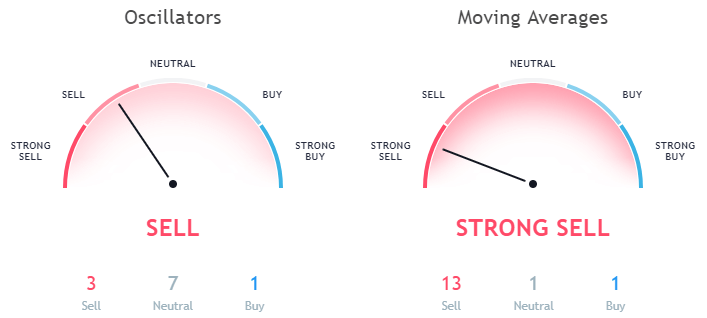
1h Price Forecast
Now let’s have a look at the 1h price forecast. The Exponential Moving Average (10) for Tron TRX is 0.021740 while the Simple Moving Average (10) is 0.021818. Here both EMA (10) and SMA (10) is indicating a sell signal. Not only this all other moving averages like EMA (20, 30, 50, 100, 200) and SMA (20, 30, 50, 100, 200) are also in the sell zone.
Data as per TradingView
The only moving average under 1h price forecast which is in the buy zone is Hull Moving Average (9) with a value of 0.021354
Even if we look at the Oscillators for 1h price forecast the Relative Strength Index (14) is 40.143670 which is in the neutral zone. The MACD Level (12, 27) is in the sell zone with a value of -0.000136.
Conclusion
As per the analysis based on the different moving averages, graphs and Oscillators Tron TRX will take some time for a bullish move. However, you can HODL it as the price of Tron TRX is too low now.
This article should not be considered as an investment advice. Please conduct your own research before investing in any cryptocurrency.
Disclaimer: Koinalert’s content is only for information purpose in nature and should not be considered as investment advice. Do your own market research before investing in any cryptocurrencies. The author or publication does not hold any responsibility for your personal financial loss.


iGaming Platform BC.GAME Signs $40 Million Deal to Become Principal Partner of Leicester City

Coinbase faces new lawsuit that claims SOL, MATIC, NEAR, MANA, ALGO, UNI, XTZ and XLM are securities

Service Beyond Gaming: The Support Experience at HugeWin

Bitcoin (BTC) Cycle: Aiming for $155,000 Peak by August 2025
