
Price Analysis
Ripple [XRP] Price Prediction, Technical Analysis – September 24th
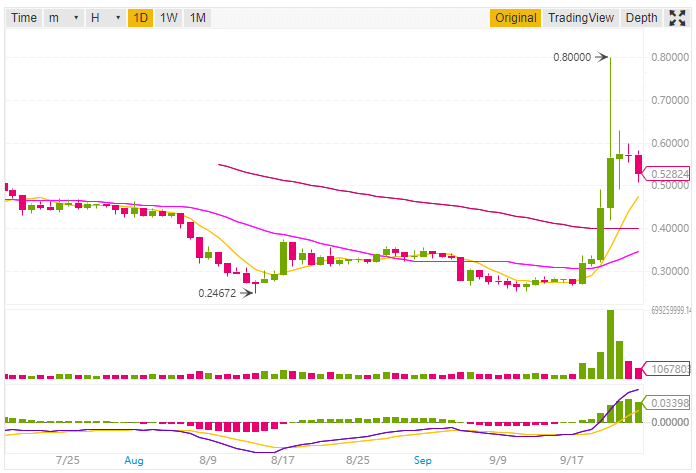
Ripple XRP the 3rd largest cryptocurrency by market capitalization is currently trading at $0.528447 USD (-9.22%) according to Coinmarketcap while writing this post. The 24h High for this cryptocurrency is $0.59264 and 24h Low is $0.50750 (As per Binance XRP/USDT pair). The market capitalization for Ripple XRP while writing this post is $21,037,002,804 USD.
Its seems that Ripple has found support level as predicted by us yesterday. Today’s support level as per our prediction will be $0.50, $0.46 or $0.40
Ripple Price Prediction and Technical Analysis
We will do the analysis in two parts, the first will be based on 1-day price forecast while the other will be 1h price forecast.
1-day Price Forecast
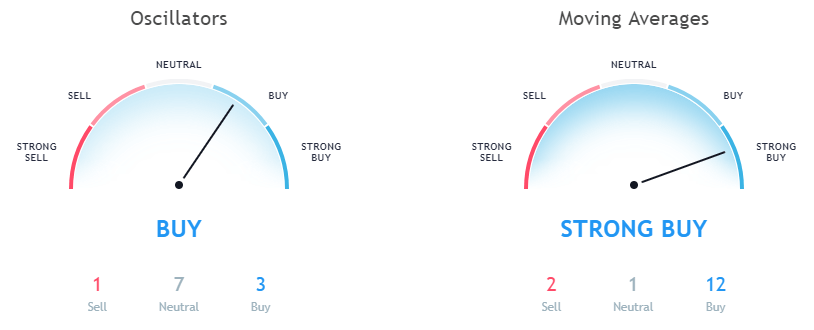
While looking at the 1-day forecast the 10-day Exponential Moving Average is 0.45175 and 20-day Exponential Moving Average (EMA) is 0.39396. Now both of these data shows buying, also while looking at the 10-day Simple Moving Average which is 0.41645 and 20-day Simple Moving Average (20) which is 0.34716 recommending buying.
Data as per Binance
Data as per TradingView
While looking at the Oscillators the Relative Strength Index (14) is 72.58440 which is in the Neutral Zone and the MACD Level (12, 27) is 0.05492 recommending buying.
1h Price Forecast
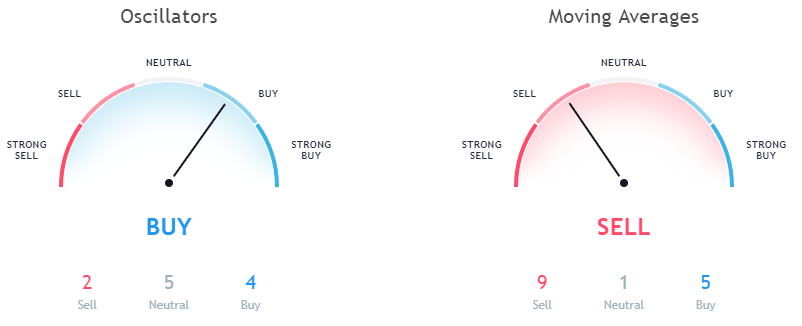
Now let us discuss the price forecast based on 1-hour price graph. While looking at the Moving Averages of 1h price graph the Exponential Moving Average (10) is 0.54532 and Simple Moving Average (10) is 0.55245 both of them is indicating a sell signal. Not only this the EMA (20, 30) and SMA (20, 30) is also indicating a sell signal. So it seems that Ripple XRP today is not good for short-term investment.
Data as per Binance
Also, while looking at the Oscillators the Relative Strength Index (14) in the 1h forecast is 35.40906 which is in the neutral zone. The MACD level (12, 27) is -0.00997 indicating a sell signal. Also, the Awesome Oscillator which is -0.03016 indicating a sell signal.
This article should not be considered as an investment advice. Please conduct your own research before investing in any cryptocurrency.
Disclaimer: Koinalert’s content is only for information purpose in nature and should not be considered as investment advice. Do your own market research before investing in any cryptocurrencies. The author or publication does not hold any responsibility for your personal financial loss.


iGaming Platform BC.GAME Signs $40 Million Deal to Become Principal Partner of Leicester City

Coinbase faces new lawsuit that claims SOL, MATIC, NEAR, MANA, ALGO, UNI, XTZ and XLM are securities

Service Beyond Gaming: The Support Experience at HugeWin

Bitcoin (BTC) Cycle: Aiming for $155,000 Peak by August 2025
