
Price Analysis
Ripple [XRP] Price Prediction, Technical Analysis – September 23rd
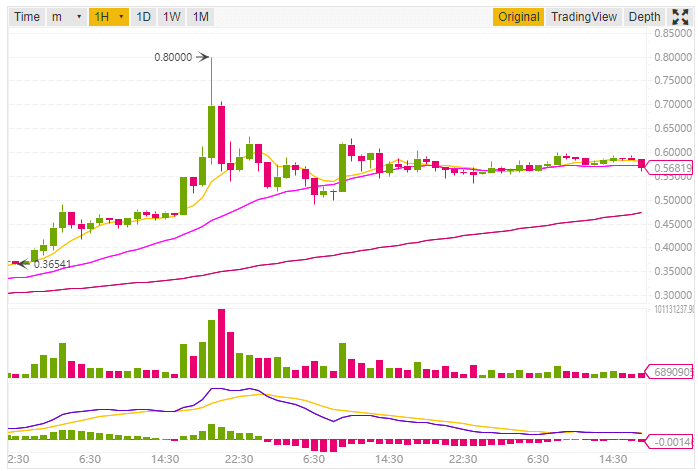
Ripple XRP the 3rd largest cryptocurrency by market capitalization is currently trading at $0.573209 USD (-0.19%) according to Coinmarketcap while writing this post. The 24h High for this cryptocurrency is $0.605000 and 24h Low is $0.53500 (As per Binance XRP/USDT pair). The market capitalization for Ripple XRP while writing this post is $22,780,964,610 USD.
Yesterday Ripple was up more than 10% but today it seems that it has found its support level.
Ripple Price Prediction and Technical Analysis
We will do the analysis in two parts, the first will be based on 1-day price forecast while the other will be 1h price forecast.
1-day Price Forecast
While looking at the 1-day forecast the 10-day Exponential Moving Average is 0.43366 and 20-day Exponential Moving Average (EMA) is 0.37925. Now both of these data shows buying, also while looking at the 10-day Simple Moving Average which is 0.39063 and 20-day Exponential Moving Average (20) which is 0.37925 recommending buying.
Data as per Binance
Yesterday the EMA (200) and SMA (200) was broken by Ripple XRP as predicted by us in our previous post. Here point to be noted is that EMA (10, 20, 30, 50, 100, 200) as well as SMA (10, 20, 30, 50, 100, 200) all moving averages are indicating a buy signal. So it seems that another bullish move is on its way.
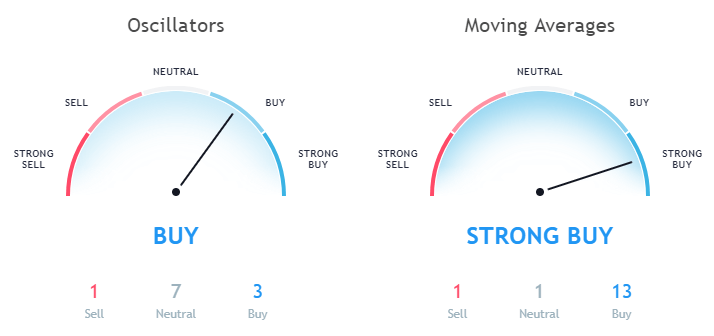
Data as per TradingView
While looking at the Oscillators the Relative Strength Index (14) is 81.06230 which is in the Neutral Zone and the MACD Level (12, 27) is 0.04930 recommending buying.
1h Price Forecast
Now let us discuss the price forecast based on 1-hour price graph. While looking at the Moving Averages of 1h price graph the Exponential Moving Average (10) is 0.57766 and Simple Moving Average (10) is 0.58229 both of them is indicating a sell signal. Not only this the EMA (20, 30) and SMA (20, 30) is also indicating a sell signal. So it seems that Ripple XRP today is not good for short-term investment.
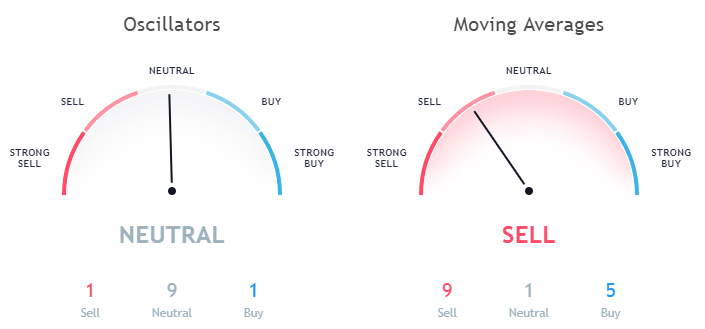
Data as per TradingView
Also, while looking at the Oscillators the Relative Strength Index (14) in the 1h forecast is 45.25625 which is in the neutral zone. The MACD level (12, 27) is 0.00570 indicating a sell signal. Also, the Awesome Oscillator which is 0.01007 is in the neutral zone.
This article should not be considered as an investment advice. Please conduct your own research before investing in any cryptocurrency.
Disclaimer: Koinalert’s content is only for information purpose in nature and should not be considered as investment advice. Do your own market research before investing in any cryptocurrencies. The author or publication does not hold any responsibility for your personal financial loss.


iGaming Platform BC.GAME Signs $40 Million Deal to Become Principal Partner of Leicester City

Coinbase faces new lawsuit that claims SOL, MATIC, NEAR, MANA, ALGO, UNI, XTZ and XLM are securities

Service Beyond Gaming: The Support Experience at HugeWin

Bitcoin (BTC) Cycle: Aiming for $155,000 Peak by August 2025
