
Price Analysis
Ripple [XRP] Price Prediction, Technical Analysis – September 22nd

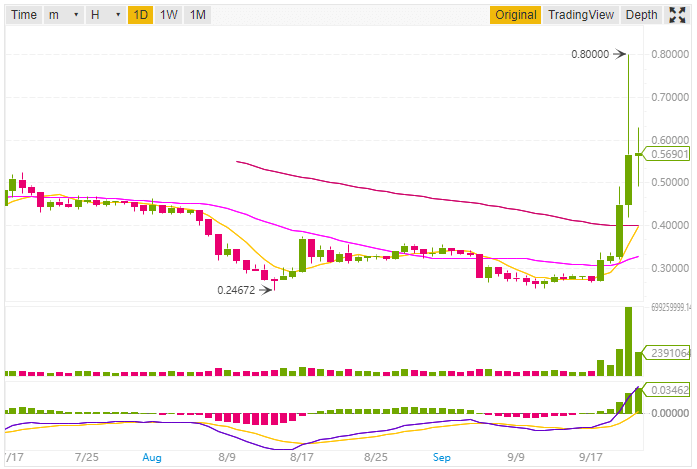
Ripple XRP the 3rd largest cryptocurrency by market capitalization is currently trading at $0.568223 (16.48%) according to Coinmarketcap while writing this post. The 24h High for this cryptocurrency is $0.80000 and 24h Low is $0.47005 (As per Binance XRP/USDT pair). The market capitalization for Ripple XRP while writing this post is $22,620,411,500 USD.
Yesterday Ripple XRP was on a massive bullish move as price surges more than 70 %. Ripple is on a bullish move since from last 3-4 days. If we see at the price rise it is +100% yes you read it right it has doubled within 7 days. As we predicted yesterday that Ripple will soon go to the MOON has proven now.
There are many factors on which the rise in the price of Ripple depends. Here are the major factors that have led to such a rise in the price of XRP.
- National Commercial Bank of Saudi Arabia joins RippleNet
- PNC Bank Joins RippleNet
- xRapid Announcement
Also, OKCoin has listed over 5 cryptocurrency token for exchange on its platform. The cryptocurrencies include 0x (ZRX), XRP, Cardano (ADA), Stellar (XLM) and Zcash (ZEC).
Ripple Price Prediction and Technical Analysis
We will do the analysis in two parts, the first will be based on 1-day price forecast while the other will be 1h price forecast.
1-day Price Forecast
While looking at the 1-day forecast the 10-day Exponential Moving Average is 0.40322 and 20-day Exponential Moving Average (EMA) is 0.35905. Now both of these data shows buying, also while looking at the 10-day Simple Moving Average which is 0.36141 recommends buying.
Data as per Binance
Yesterday the EMA (200) and SMA (200) was not broken by Ripple XRP but today it has broken all the EMA (10, 20, 30, 50, 100, 200) as well as SMA (10, 20, 30, 50, 100, 200). So all the Moving Averages are indicating towards a massive buying.
The Relative Strength Index (14) is 82.99917 which is indicating selling and the MACD Level (12, 27) is 0.03793 recommending buying.
1h Price Forecast
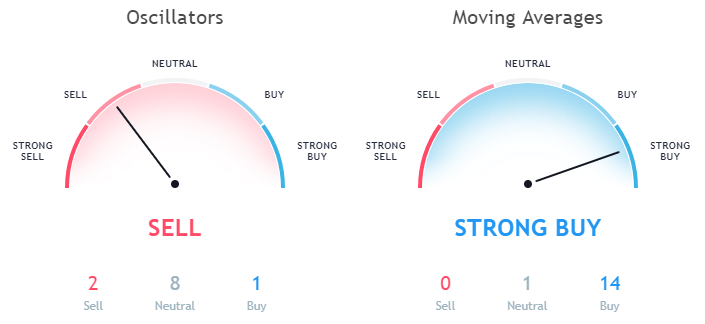
Let’s discuss the price forecast based on the 1-hour price chart. The Exponential Moving Average (10) is 0.57003 and Simple Moving Average (10) is 0.57016 both of them indicating buy signal. Not only this, when we look at the EMA (20, 30, 50, 100, 200) and SMA (20, 30, 50, 100, 200) all of these, are indicating towards buying. So it seems that Ripple is in a massive bullish move for short-term investment too.
Data as per TradingView
But while looking at the Oscillators the Relative Strength Index (14) in the 1h forecast is 54.10611 which is in the neutral zone. The MACD level (12, 27) is 0.02029 indicating a sell signal. Also, the Awesome Oscillator which is 0.03330 is in the neutral zone.
This article should not be considered as an investment advice. Please conduct your own research before investing in any cryptocurrency.
Disclaimer: Koinalert’s content is only for information purpose in nature and should not be considered as investment advice. Do your own market research before investing in any cryptocurrencies. The author or publication does not hold any responsibility for your personal financial loss.
![Dogecoin [DOGE] Price Analysis Before and After Elon Musk SNL Tweet](https://www.koinalert.com/wp-content/uploads/2021/05/Dogecoin-price-analysis-after-Elon-Musk-SNL-tweet-400x240.jpg)
![Dogecoin [DOGE] Price Analysis Before and After Elon Musk SNL Tweet](https://www.koinalert.com/wp-content/uploads/2021/05/Dogecoin-price-analysis-after-Elon-Musk-SNL-tweet-80x80.jpg)


iGaming Platform BC.GAME Signs $40 Million Deal to Become Principal Partner of Leicester City

Coinbase faces new lawsuit that claims SOL, MATIC, NEAR, MANA, ALGO, UNI, XTZ and XLM are securities

Service Beyond Gaming: The Support Experience at HugeWin

Bitcoin (BTC) Cycle: Aiming for $155,000 Peak by August 2025
