
Price Analysis
Ripple [XRP] Price Prediction, Technical Analysis – September 21st
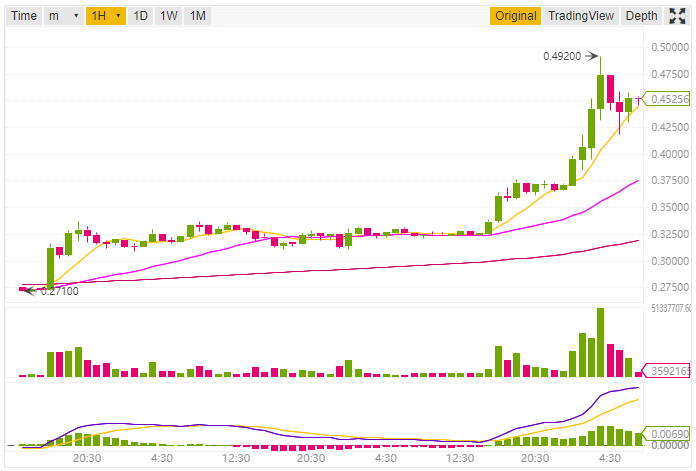
Ripple XRP the 3rd largest cryptocurrency by market capitalization is currently trading at $0.450215(38.13%) according to Coinmarketcap while writing this post. The 24h High for this cryptocurrency is $0.49200 and 24h Low is $0.32103 (As per Binance XRP/USDT pair). The market capitalization for Ripple XRP while writing this post is $17,922,652,919 USD.
It seems that Ripple [XRP] is in another massive bullish move today as the price skyrocket more than 38% percent within minutes. It was also on a bullish move on 20th September as we predict in our previous post. Its seems Ripple XRP is on its way to the MOON.
The price of Ripple XRP is increasing these days, the reason behind this bullish move may be the recent announcement that top ten US banks are going to join RippleNet for Cross-border payments. Also, there is news that one of the major retail Saudi Bank joins the Ripple network for International payments.
Also, one of the world’s most renowned digital asset platform, OKCoin has listed over 5 cryptocurrency token for exchange on its platform. The cryptocurrencies include 0x (ZRX), XRP, Cardano (ADA), Stellar (XLM) and Zcash (ZEC).
Ripple Price Prediction and Technical Analysis
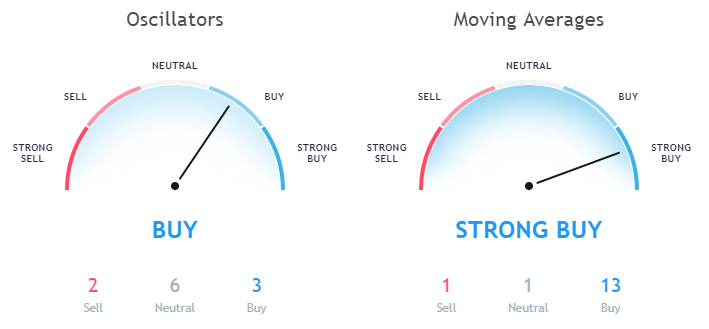
While looking at the 1-day forecast the 10-day Exponential Moving Average is 0.34744 and 20-day Exponential Moving Average (EMA) is 0.32702. Now both of these data shows buying, also while looking at the 10-day Simple Moving Average which is 0.32106 recommends buying.
Data As Per Binance
Not only this the Ripple price today is has broken EMA (20, 30, 50, 100) as well as SMA (20, 30, 50, 100) recommending buying. But while looking at the Exponential Moving Average (200) which is 0.50547 and Simple Moving Average (200) is 0.54213.
As we see Ripple XRP is still below 200 day EMA and SMA, but due to its massive bullish move, it seems that it will break 200-day EMA & SMA within hours.
The Relative Strength Index (14) is 76.03164 which is indicating selling and the MACD Level (12, 27) is 0.01393 recommending buying.
1h Price Forecast
Let’s discuss the price forecast based on the 1-hour price chart. The Exponential Moving Average (10) is 0.42929 and Simple Moving Average (10) is 0.42548 both of them indicating buy signal. Not only this, when we look at the EMA (20, 30, 50, 100, 200) and SMA (20, 30, 50, 100, 200) all of these, are indicating towards buying. So it seems that Ripple is in a massive bullish move for short-term investment too.
Data As Per TradingView
But while looking at the Oscillators the Relative Strength Index (14) in the 1h forecast is 74.81603 indicating selling. The MACD level (12, 27) is 0.03303 indicating a buy signal. Also, the Awesome Oscillator which is 0.09332 is indicating towards buy signal.
This article should not be considered as an investment advice. Please conduct your own research before investing in any cryptocurrency.
Disclaimer: Koinalert’s content is only for information purpose in nature and should not be considered as investment advice. Do your own market research before investing in any cryptocurrencies. The author or publication does not hold any responsibility for your personal financial loss.


iGaming Platform BC.GAME Signs $40 Million Deal to Become Principal Partner of Leicester City

Coinbase faces new lawsuit that claims SOL, MATIC, NEAR, MANA, ALGO, UNI, XTZ and XLM are securities

Service Beyond Gaming: The Support Experience at HugeWin

Bitcoin (BTC) Cycle: Aiming for $155,000 Peak by August 2025
