
Price Analysis
Ripple [XRP] Price Prediction, Technical Analysis – September 20th
Ripple XRP the 3rd largest cryptocurrency by market capitalization is currently trading at $0.349902 (9.12%) according to Coinmarketcap while writing this post. The 24h High for this cryptocurrency is $0.35708 and 24h Low is $0.31090(As per Binance XRP/USDT pair). The market capitalization for Ripple XRP while writing this post is $13,929,265,069 USD.
It seems that Ripple [XRP] is in another bullish move today as the price skyrocket about 10 percent within minutes. It was also on a bullish move on 19th September as we predict in our previous post.
The price of Ripple XRP is increasing these days, the reason behind this bullish move may be the recent announcement that top ten US banks are going to join RippleNet for Cross-border payments. Also, there is news that one of the major retail Saudi Bank joins the Ripple network for International payments.
Ripple Price Prediction and Technical Analysis
While looking at the 1-day forecast the 10-day Exponential Moving Average is 00.30472 and 20-day Exponential Moving Average (EMA) is 0.30374. Now both of these data shows buying, also while looking at the 10-day Simple Moving Average which is 0.29164 recommends buying.
Not only this the Ripple price today has broken the 50-day SMA and EMA. It has crossed the EMA (20, 30, 50) as well as SMA (20, 30, 50). But the Exponential Moving Average (100) is still to be achieved, as per the situation it seems that it will soon break the 50-day EMA and SMA.
Data as per Binance
The Relative Strength Index (14) is 61.96295 which is in the neutral zone and the MACD Level (12, 27) is -0.00496 recommending buying.
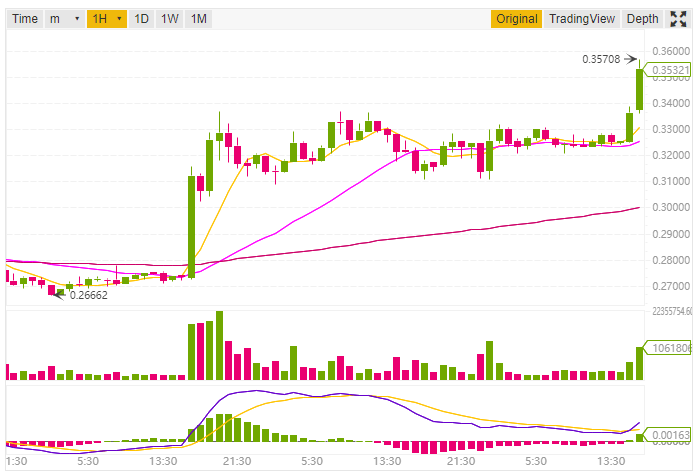
Let’s discuss the price forecast based on the 1-hour price chart. The Exponential Moving Average (10) is 0.33282 and Simple Moving Average is 0.32934 both of them indicating buy signal. Not only this, when we look at the EMA (20, 30, 50, 100) and SMA (20, 30, 50, 100) all of these, are indicating towards buying. So it seems that Ripple is in a bullish move for short-term investment too.
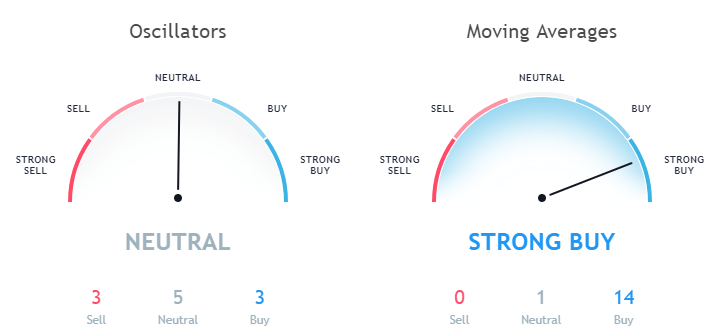
Data as per TradingView
The Relative Strength Index (14) in the 1h forecast is 75.13580. The MACD level (12, 27) is 0.00498 indicating a buy signal.
This article should not be considered as an investment advice. Please conduct your own research before investing in any cryptocurrency.
Disclaimer: Koinalert’s content is only for information purpose in nature and should not be considered as investment advice. Do your own market research before investing in any cryptocurrencies. The author or publication does not hold any responsibility for your personal financial loss.
![Dogecoin [DOGE] Price Analysis Before and After Elon Musk SNL Tweet](https://www.koinalert.com/wp-content/uploads/2021/05/Dogecoin-price-analysis-after-Elon-Musk-SNL-tweet-400x240.jpg)
![Dogecoin [DOGE] Price Analysis Before and After Elon Musk SNL Tweet](https://www.koinalert.com/wp-content/uploads/2021/05/Dogecoin-price-analysis-after-Elon-Musk-SNL-tweet-80x80.jpg)


iGaming Platform BC.GAME Signs $40 Million Deal to Become Principal Partner of Leicester City

Coinbase faces new lawsuit that claims SOL, MATIC, NEAR, MANA, ALGO, UNI, XTZ and XLM are securities

Service Beyond Gaming: The Support Experience at HugeWin

Bitcoin (BTC) Cycle: Aiming for $155,000 Peak by August 2025
