
Price Analysis
Ripple [XRP] Price Prediction, Technical Analysis – September 26th
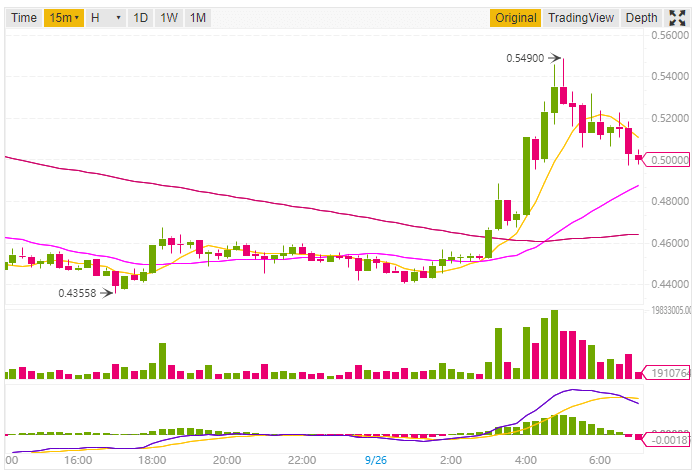
Ripple XRP the 3rd largest cryptocurrency by market capitalization is currently trading at $0.505334 USD (7.87%) according to Coinmarketcap while writing this post. The 24h High for this cryptocurrency is $0.54900 and 24h Low is $0.43558 (As per Binance XRP/USDT pair). The market capitalization for Ripple XRP while writing this post is $20,148,128,423 USD.
As you will see in the graph below the price of Ripple XRP suddenly surges. What’s the reason behind this price Surge?
Coinbase hints about listing more coins, this is the reason behind this sudden price surge. Coinbase is overhauling its cryptocurrency listing process.
Ripple Price Prediction and Technical Analysis
We will do the analysis in two parts, the first will be based on 1-day price forecast while the other will be 1h price forecast.
1-day Price Forecast
While looking at the 1-day forecast the 10-day Exponential Moving Average is 0.46746 and 20-day Exponential Moving Average (EMA) is 0.41276. Now both of these data shows buying, also while looking at the 10-day Simple Moving Average which is 0.45945 and 20-day Simple Moving Average (20) which is 0.36769 recommending buying.
Data as per Binance
Here point to be noted is that EMA (10, 20, 30, 50, 100) as well as SMA (10, 20, 30, 50, 100) all moving averages are indicating a buy signal. Only Exponential Moving Average (200) and Simple Moving Averages (200) is showing a sell signal. So it seems that another bullish move is on its way.
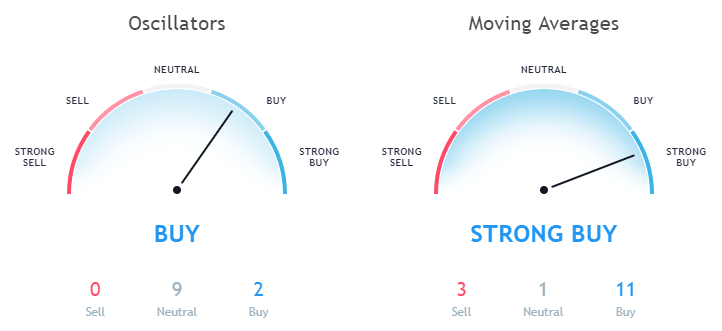
Data as per TradingView
While looking at the Oscillators the Relative Strength Index (14) is 64.71521 which is in the Neutral Zone and the MACD Level (12, 27) is 0.05637 recommending buying.
1h Price Forecast
Now let us discuss the price forecast based on 1-hour price graph. While looking at the Moving Averages of 1h price graph the Exponential Moving Average (10) is 0.48582 and Simple Moving Average (10) is 0.47665 both of them is indicating a buy signal. Not only this the EMA (20, 30) and SMA (20, 30) is also indicating a buy signal. So it seems that Ripple XRP today is in a bullish move for short-term investment.
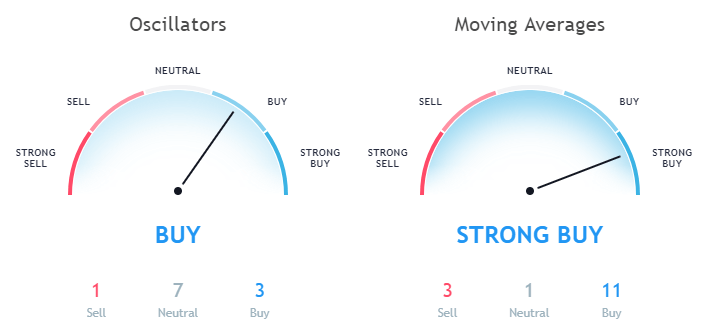
Data as per TradingView
Also, while looking at the Oscillators the Relative Strength Index (14) in the 1h forecast is 55.51881 which is in the neutral zone. The MACD level (12, 27) is 0.00231 indicating a buy signal. Also, the Awesome Oscillator which is 0.02487 indicating a buy signal.
This article should not be considered as an investment advice. Please conduct your own research before investing in any cryptocurrency.
Disclaimer: Koinalert’s content is only for information purpose in nature and should not be considered as investment advice. Do your own market research before investing in any cryptocurrencies. The author or publication does not hold any responsibility for your personal financial loss.


iGaming Platform BC.GAME Signs $40 Million Deal to Become Principal Partner of Leicester City

Coinbase faces new lawsuit that claims SOL, MATIC, NEAR, MANA, ALGO, UNI, XTZ and XLM are securities

Service Beyond Gaming: The Support Experience at HugeWin

Bitcoin (BTC) Cycle: Aiming for $155,000 Peak by August 2025
