
Price Analysis
Bitcoin Cash [BCH] Price Prediction, Technical Analysis – September 27th
Bitcoin Cash BCH is currently the 4th largest cryptocurrency by market capitalization. It is currently trading at $516.40 USD (16.68%) as per Coinmarketcap at the time of writing this post.
Bitcoin Cash is trading up 20.78% from the previous week. The market capitalization for BCH cryptocurrency while writing this post is $8,970,385,192 USD and 24h trading volume is $1,037,729,538 USD.
As you see Bitcoin Cash surges more than 20% after Bitmain files for Initial Public Offering (IPO). Bitmain is one of the world’s largest digital currency miners. As per MarketWatch, the Bitmain has made $700 million worth of profit during the six months ending June 2018.
Bitcoin Cash Price Prediction and Technical Analysis
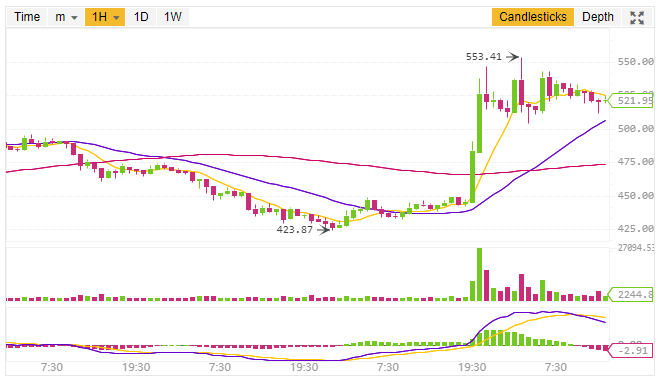
Today Bitcoin Cash BCH is on a massive bullish move. Here I will do the analysis in two parts first one will be on the basis of the 1-day price forecast while the other one will be on 1h price forecast.
1-day Price Forecast
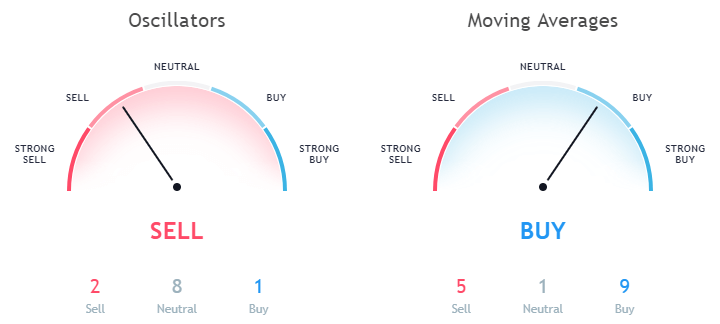
The 10-day Exponential Moving Average for BCH is 481.9 while the 10-day Simple Moving Average is 474. Both of the above EMA (10) and SMA (10) is indicating a buy signal. Let’s have a look at the other EMA and SMA in order to better clarify the trends.
Data as per Binance
The EMA (20, 30) is 484.2 and 498.6 respectively. Here EMA (20, 30) is towards a buy signal, while EMA (50, 100) is indicating a sell signal. Also, the SMA (20, 30) for BCH is 462.9 and 498.8 respectively. All these SMA (20, 30) for the 1-day price forecast is indicating a strong buy signal.
Data as per TradingView
While the EMA (50, 100) is indicating towards a sell signal. But while looking at the Oscillators, the MACD Level (12, 27) is -11.7 indicating a buy signal. The Relative Strength Index (14) is 54.4 which is in the Neutral zone.
1h Price Forecast
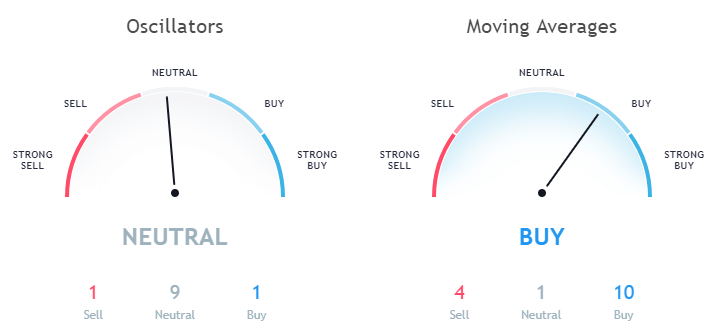
Now let’s have a look at the 1h price forecast. The Exponential Moving Average (10) for Bitcoin Cash BCH is 523.3 while the Simple Moving Average (10) is 527. Both EMA (10) and SMA (10) is indicating towards a sell signal.
Data as per Binance
Also, the other EMA like EMA (20, 30, 50, 100) is towards a buy signal. Similar is the case with the SMA (20, 30, 50, 100). Even if we look at the Oscillators for 1h price forecast the Relative Strength Index (14) is 60.9 which is in the neutral zone. The MACD Level (12, 27) is in the sell zone with a value of 15.4.
This article should not be considered as an investment advice. Please conduct your own research before investing in any cryptocurrency.
Disclaimer: Koinalert’s content is only for information purpose in nature and should not be considered as investment advice. Do your own market research before investing in any cryptocurrencies. The author or publication does not hold any responsibility for your personal financial loss.


![Bitcoin Cash [BCH] on a Bullish move](https://www.koinalert.com/wp-content/uploads/2018/12/Bitcoin-Cash-BCH-on-a-Bullish-move-400x240.jpg)
![Bitcoin Cash [BCH] on a Bullish move](https://www.koinalert.com/wp-content/uploads/2018/12/Bitcoin-Cash-BCH-on-a-Bullish-move-80x80.jpg)


![Ripple supporters raged over Craig Wright's remarks on Ripple [XRP]](https://www.koinalert.com/wp-content/uploads/2018/11/Ripple-supporters-raged-over-Craig-Wright-remarks-on-Ripple-XRP-400x240.jpg)
![Ripple supporters raged over Craig Wright's remarks on Ripple [XRP]](https://www.koinalert.com/wp-content/uploads/2018/11/Ripple-supporters-raged-over-Craig-Wright-remarks-on-Ripple-XRP-80x80.jpg)

iGaming Platform BC.GAME Signs $40 Million Deal to Become Principal Partner of Leicester City

Coinbase faces new lawsuit that claims SOL, MATIC, NEAR, MANA, ALGO, UNI, XTZ and XLM are securities

Service Beyond Gaming: The Support Experience at HugeWin

Bitcoin (BTC) Cycle: Aiming for $155,000 Peak by August 2025
