
Price Analysis
Ripple [XRP] Price Prediction, Technical Analysis – September 27th
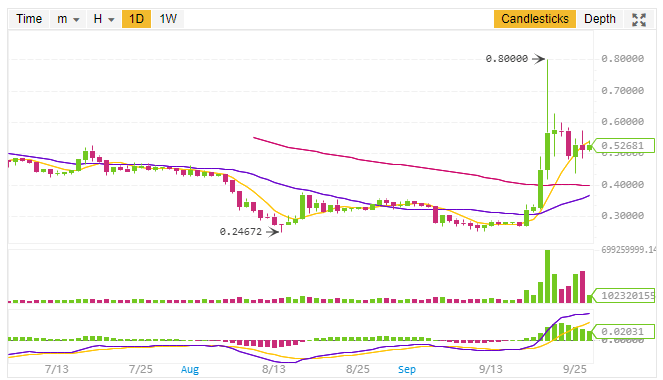
Ripple XRP the 3rd largest cryptocurrency by market capitalization is currently trading at $0.528386 USD (-4.17%) according to Coinmarketcap while writing this post. The 24h High for this cryptocurrency is $0.55949 and 24h Low is $0.49616 (As per Binance XRP/USDT pair). The market capitalization for Ripple XRP while writing this post is $21,067,214,508 USD (CoinMarketCap).
As per the latest news, Japanese regulators have granted SBI Ripple Asia a Payments Licence for its Blockchain based app. As per the statement,
“SBI Ripple Asia is planning to register the electronic settlement and other settlement enterprises in order to properly implement electronic payments and other settlement aspects related to MoneyTap in the future.”
Ripple Price Prediction and Technical Analysis
We will do the analysis in two parts, the first will be based on 1-day price forecast while the other will be 1h price forecast.
1-day Price Forecast
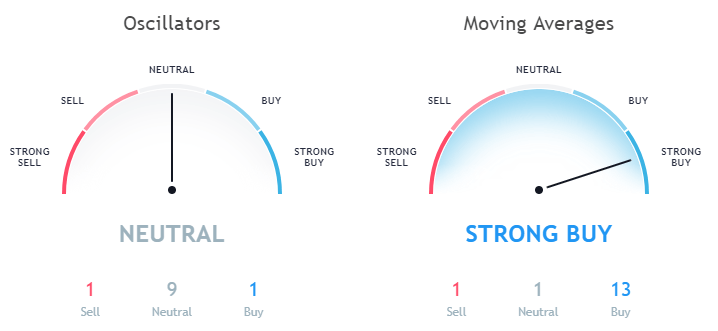
In the 1-day price forecast, the Exponential Moving Average (10) is 0.48008 while the Simple Moving average is 0.48629. Both of these data is indicating a buy signal. Not only this even the EMA (20, 30, 50, 100) as well as SMA (20, 30, 50, 100) is also indicating towards a buy signal.
Data as per Binance
Only the Simple Moving Average (200) is indicating a sell signal with a value of 0.53383 which I think will be in the buy zone soon. It seems the next bull run is on its way.
Data as per TradingView
While looking at the Oscillators the Relative Strength Index (14) is 67.88170 which is in the Neutral Zone and the MACD Level (12, 27) is 0.05886 recommending buying. The only oscillator which is in the sell zone is Momentum (10) with a value of 0.25758.
1h Price Forecast
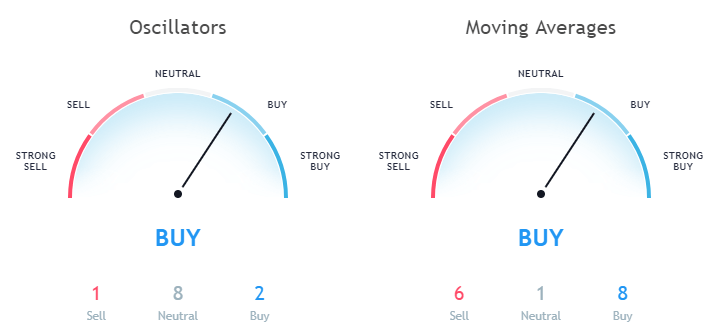
Now let us discuss the price forecast based on 1-hour price graph. While looking at the Moving Averages of 1h price graph the Exponential Moving Average (10) is 0.52353 and Simple Moving Average (10) is 0.52176. EMA (10) is indicating a sell signal while SMA (10) is indicating towards a buy signal.
Not only this the EMA (20) and SMA (20) is also indicating a sell signal. So it seems that Ripple XRP today is in a bullish move for short-term investment.
Data as per TradingView
Also, while looking at the Oscillators the Relative Strength Index (14) in the 1h forecast is 50.37626 which is in the neutral zone. The MACD level (12, 27) is 0.00114 indicating a sell signal. Also, the Awesome Oscillator which is -0.00403 indicating a buy signal.
This article should not be considered as an investment advice. Please conduct your own research before investing in any cryptocurrency.
Disclaimer: Koinalert’s content is only for information purpose in nature and should not be considered as investment advice. Do your own market research before investing in any cryptocurrencies. The author or publication does not hold any responsibility for your personal financial loss.


iGaming Platform BC.GAME Signs $40 Million Deal to Become Principal Partner of Leicester City

Coinbase faces new lawsuit that claims SOL, MATIC, NEAR, MANA, ALGO, UNI, XTZ and XLM are securities

Service Beyond Gaming: The Support Experience at HugeWin

Bitcoin (BTC) Cycle: Aiming for $155,000 Peak by August 2025
