
Price Analysis
Ripple [XRP] Price Prediction, Technical Analysis – September 28th
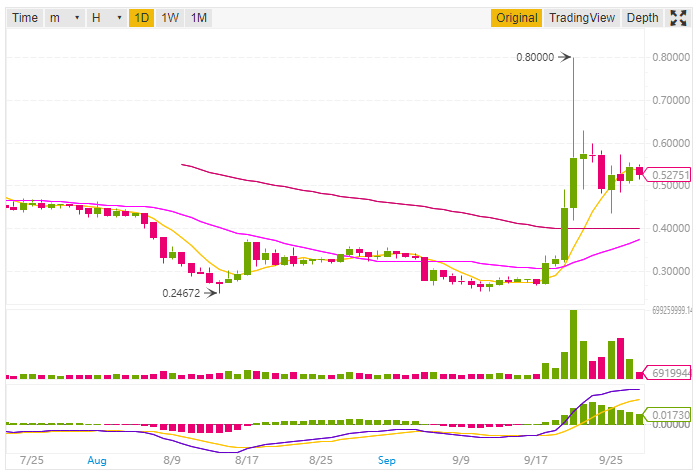
Ripple XRP the 3rd largest cryptocurrency by market capitalization is currently trading at $0.532935 USD (2.30%) according to Coinmarketcap while writing this post. The 24h High for this cryptocurrency is $0.55500 and 24h Low is $0.51400 (As per Binance XRP/USDT pair). The market capitalization for Ripple XRP while writing this post is $21,248,584,834 USD (CoinMarketCap).
As you know yesterday Ripple (XRP) has introduced a social impact program by the corporate, aimed at supporting organizations that help increase financial literacy amongst people. “Ripple for Good“, as the program is being called, will support these mission-driven initiatives, groups, and organizations.
Furthermore, they are focusing on helping these organizations achieve financial inclusion. It has put in a whopping $100 million in the initiative.
Also, Japanese regulators have granted SBI Ripple Asia a Payments Licence for its Blockchain based app.
Ripple Price Prediction and Technical Analysis
We will do the analysis in two parts, the first will be based on 1-day price forecast while the other will be 1h price forecast.
1-day Price Forecast
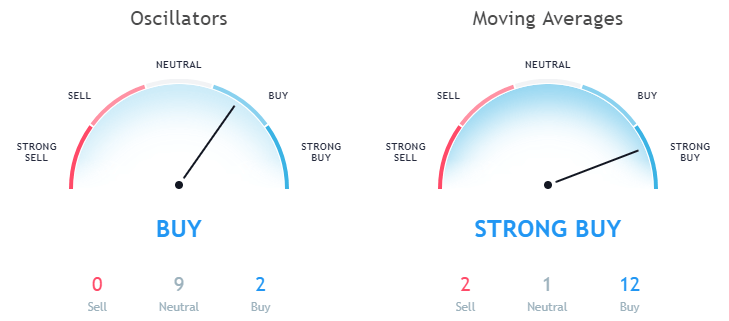
While looking at the Moving averages it seems that all the moving averages are indicating a buy signal. The Exponential Moving Average (10) is 0.49 while the Simple Moving average is 0.50. Here both the EMA (10) and SMA (10) is indicating a buy signal. Not only this even the EMA (20, 30, 50, 100) as well as SMA (20, 30, 50, 100) is also indicating towards a buy signal.
Data as per Binance
Only the Simple Moving Average (200) is indicating a sell signal with a value of 0.53261. Here the supporting level for XRP Ripple is EMA (10) i.e. $0.50
Data as per TradingView
While looking at the Oscillators the Relative Strength Index (14) is 65.29591 which is in the Neutral Zone and the MACD Level (12, 27) is 0.05994 recommending buying. Momentum (10) is also in the buying zone having a value of 0.20309.
1h Price Forecast
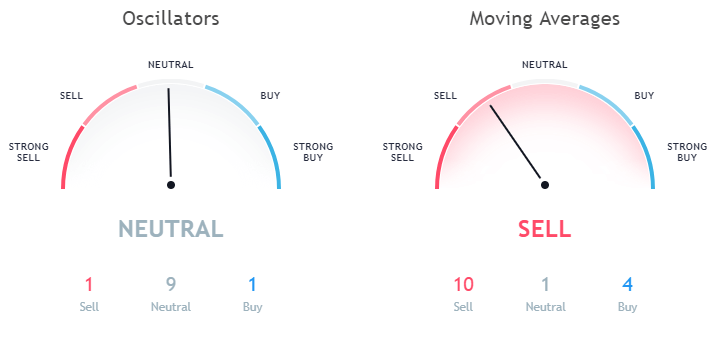
Now let us discuss the price forecast based on 1-hour price graph. While looking at the Moving Averages of 1h price graph the Exponential Moving Average (10) is 0.53414 and Simple Moving Average (10) is 0.53629. Here both the EMA (10) and SMA (10) is indicating a sell signal.
Data as per TradingView
Not only this the EMA (20, 30, 50) and SMA (20, 30, 50) is also indicating a sell signal.
Also, while looking at the Oscillators the Relative Strength Index (14) in the 1h forecast is 42.64752 which is in the neutral zone. The MACD level (12, 27) is 0.00109 indicating a sell signal. While the Awesome Oscillator having a value of -0.00278 is in the Neutral zone.
This article should not be considered as an investment advice. Please conduct your own research before investing in any cryptocurrency.
Disclaimer: Koinalert’s content is only for information purpose in nature and should not be considered as investment advice. Do your own market research before investing in any cryptocurrencies. The author or publication does not hold any responsibility for your personal financial loss.


iGaming Platform BC.GAME Signs $40 Million Deal to Become Principal Partner of Leicester City

Coinbase faces new lawsuit that claims SOL, MATIC, NEAR, MANA, ALGO, UNI, XTZ and XLM are securities

Service Beyond Gaming: The Support Experience at HugeWin

Bitcoin (BTC) Cycle: Aiming for $155,000 Peak by August 2025
