
Price Analysis
Tron [TRX] Price Prediction, Technical Analysis – September 07

TRON (TRX) currently the 12th largest cryptocurrency by market capitalization is on a bullish move. It is currently trading at $0.021021 USD (-8.87%) as per Coinmarketcap at the time of writing this post. Tron is trading at a low of -12.14% from the previous week. The market capitalization for TRON cryptocurrency while writing this post is $1,382,085,115 USD and 24h trading volume is $144,047,764 USD.
Recently Abra which is a multi-cryptocurrency wallet and exchange announces that its support for Tron [TRX], Cardano [ADA] and Basic Attention Token [BAT]. Binance has also announced TRX trading competition in which 1,000,000 TRX to giveaway. In order to qualify for this competition, you have to reach the trading volume of a minimum of 300, 000 TRX either by buying or selling Tron on the Binance exchange.
Tron Price Prediction and Technical Analysis
Today TRON is on a massive Bearish move, not only this all other cryptocurrencies are in bearish move. Here I will do the analysis in two parts first one will be on the basis of the 1-day price forecast while the other one will be on 1h price forecast.
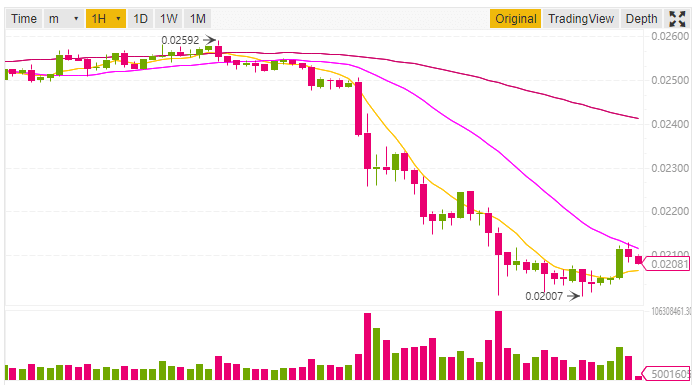
Source: Binance
1-day Price Forecast
The 10-day Exponential Moving Average for Tron TRX is 0.023661 while the 10-day Simple Moving Average is 0.024772. Both of the above EMA (10) and SMA (10) is indicating a sell signal. Let’s have a look at the other EMA and SMA in order to better clarify the signal.
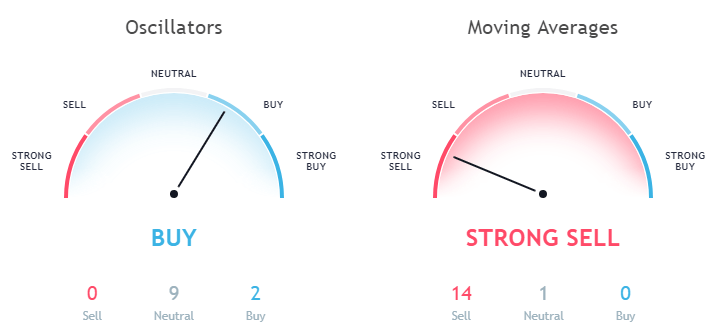
Data as Per TradingView
The EMA (20, 30, 50, 100, 200) is 0.023953, 0.024822, 0.027597, 0.034036 and 0.042335 respectively. Here all the EMA (20, 30, 50, 100, 200) is towards a sell signal. Also the SMA (20, 30, 50, 100, 200) for TRX is 0.023189, 0.022716, 0.027251, 0.035829 and 0.044601. All these SMA (20, 30, 50, 100, 200) for the 1-day price forecast is indicating a strong sell signal.
But while looking at the Oscillators, the MACD Level (12, 27) is -0.000701 indicating a buy signal. The Relative Strength Index (14) is 39.144863 which is in the Neutral zone.
1h Price Forecast
Now let’s have a look at the 1h price forecast. The Exponential Moving Average (10) for Tron TRX is 0.020785 while the Simple Moving Average (10) is 0.020634. Both these EMA (10) and SMA (10) is indicating a buy signal. But the other EMA like EMA (20, 30, 50) which is 0.021135, 0.021615 and 0.022422 respectively is towards a sell signal. Similar is the case with the SMA (20, 30, 50).
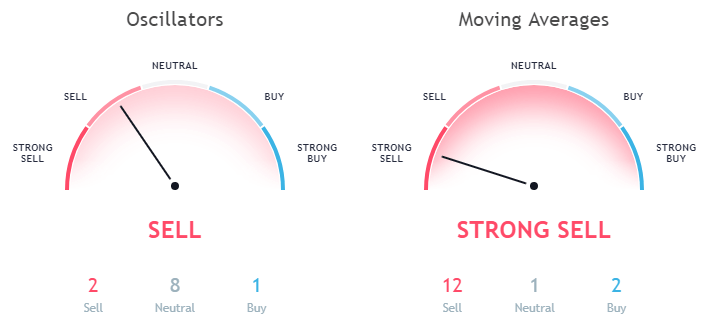
Data as Per TradingView
Even if we look at the Oscillators for 1h price forecast the Relative Strength Index (14) is 38.748800 which is in the neutral zone. The MACD Level (12, 27) is in the buy zone with a value of -0.000598.
This article should not be considered as an investment advice. Please conduct your own research before investing in any cryptocurrency.
Disclaimer: Koinalert’s content is only for information purpose in nature and should not be considered as investment advice. Do your own market research before investing in any cryptocurrencies. The author or publication does not hold any responsibility for your personal financial loss.
![Dogecoin [DOGE] Price Analysis Before and After Elon Musk SNL Tweet](https://www.koinalert.com/wp-content/uploads/2021/05/Dogecoin-price-analysis-after-Elon-Musk-SNL-tweet-400x240.jpg)
![Dogecoin [DOGE] Price Analysis Before and After Elon Musk SNL Tweet](https://www.koinalert.com/wp-content/uploads/2021/05/Dogecoin-price-analysis-after-Elon-Musk-SNL-tweet-80x80.jpg)


iGaming Platform BC.GAME Signs $40 Million Deal to Become Principal Partner of Leicester City

Coinbase faces new lawsuit that claims SOL, MATIC, NEAR, MANA, ALGO, UNI, XTZ and XLM are securities

Service Beyond Gaming: The Support Experience at HugeWin

Bitcoin (BTC) Cycle: Aiming for $155,000 Peak by August 2025
