
Price Analysis
Dogecoin [DOGE] Price Prediction, Technical Analysis – September 2nd
![Dogecoin [DOGE] Price Prediction, Technical Analysis – September 1st](https://www.koinalert.com/wp-content/uploads/2018/09/Dogecoin-today-surges-by-55-Poloniex-adds-USDT-pair.jpg)
Dogecoin today seems to be in a bearish move as the price drops by more than 24% as per the Coinmarketcap. Dogecoin which is at no. 22 in terms of market capitalization is currently trading at $0.004962 USD (-24.06%).
Dogecoin Poloniex [DOGE/USDT] Trading Pair
There are many reasons for the surge in the price of this altcoin like Yahoo Finance added the trading facility earlier this week. Poloniex which is a cryptocurrency exchange has also added the DOGE/USDT trading pair on their platform.
Around 13.42% of the trading volume for Dogecoin is from Poloniex while about 35.32%% is from Gate.io. The 24h trading volume for DOGE on Poloniex is $23,023,844 till writing this article. The data provided here is as per the Coinmarketcap. Dogecoin is popular among the crypto community for its memes known as “Doge” memes.
Dogethereum’s Launch
Some analyst has said that the sudden rise in this altcoin is the launch of Dogethereum alpha on August 18. on September 5th the Ethereum and Dogecoin demonstration is scheduled. Dogethereum is simply the collaboration between the Doge and Ethereum community.
Dogecoin Price Predictions and Technical Analysis
As mentioned above the price of DOGE have dropped more than 24% within 24h. So here is our Dogecoin predictions and technical analysis on the basis of technical data provided by TradingView.
First of all, let’s discuss the technical analysis on the basis of 1h price forecast. After looking at the Moving Averages the 10-day Exponential Moving Average is 0.00000055 which is indicating a buy signal. Not only this the EMA (20), EMA (50) and EMA (100) whose values are 0.00000048, 0.00000044 and 0.00000044 respectively. Here the good thing is that all the EMA (10, 20, 50, 100) is indicating towards a buy signal.
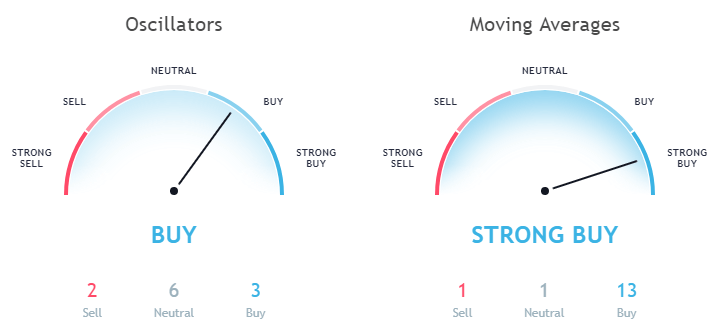
Data as Per TradingView (1-day price forecast)
While talking about the Oscillators the Relative Strength Index (14) is 67.01549500 and the MACD Level (12, 27) is 0.00000007. The MACD Level is depicting towards buy signal.
Now let’s discuss the price analysis of Dogecoin on the basis of 1h Price forecast. The EMA(10, 20, 50) for Dogecoin in 1h price forecast is 0.00000071, 0.00000075, and 0.00000073 respectively. All these Exponential Moving Averages is indicating a sell signal.
The Simple Moving Average (10, 20, 50) is 0.00000070, 0.00000079 and 0.00000076 respectively. Also, these SMA (10, 20, 50) is indicating towards sell signal.
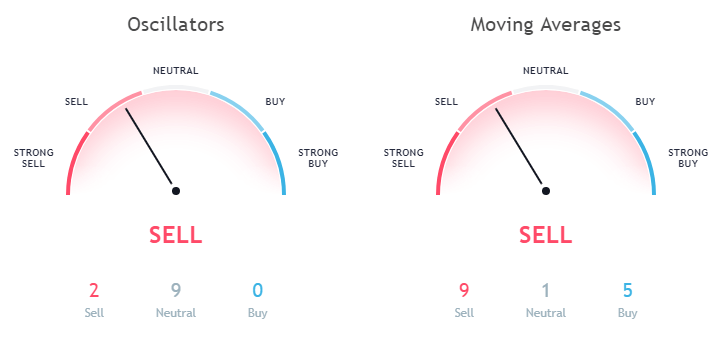
Data as Per TradingView (1-hour price forecast)
Now let us talk about the Oscillators, the Relative Strength Index (14) is 41.39684000 which is in the neutral zone. The MACD (12, 27) Level is in the sell zone with a value of -0.00000003.
This article should not be considered as an investment advice. Please conduct your own research before investing in any cryptocurrency.
Disclaimer: Koinalert’s content is only for information purpose in nature and should not be considered as investment advice. Do your own market research before investing in any cryptocurrencies. The author or publication does not hold any responsibility for your personal financial loss.


![Dogecoin [DOGE] Price Analysis Before and After Elon Musk SNL Tweet](https://www.koinalert.com/wp-content/uploads/2021/05/Dogecoin-price-analysis-after-Elon-Musk-SNL-tweet-400x240.jpg)
![Dogecoin [DOGE] Price Analysis Before and After Elon Musk SNL Tweet](https://www.koinalert.com/wp-content/uploads/2021/05/Dogecoin-price-analysis-after-Elon-Musk-SNL-tweet-80x80.jpg)


![Dogecoin [DOGE] is now available on Coinbase Wallet](https://www.koinalert.com/wp-content/uploads/2019/05/Dogecoin-now-available-on-Coinbase-Wallet-400x240.jpg)
![Dogecoin [DOGE] is now available on Coinbase Wallet](https://www.koinalert.com/wp-content/uploads/2019/05/Dogecoin-now-available-on-Coinbase-Wallet-80x80.jpg)

iGaming Platform BC.GAME Signs $40 Million Deal to Become Principal Partner of Leicester City

Coinbase faces new lawsuit that claims SOL, MATIC, NEAR, MANA, ALGO, UNI, XTZ and XLM are securities

Service Beyond Gaming: The Support Experience at HugeWin

Bitcoin (BTC) Cycle: Aiming for $155,000 Peak by August 2025
