
Price Analysis
EOS Token Price Prediction, Technical Analysis – August 29

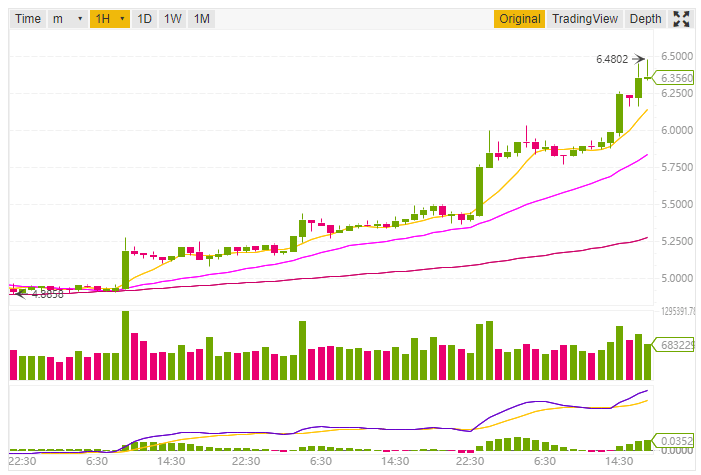
EOS the 5th largest cryptocurrency by market capitalization as per Coinmarketcap. Today EOS token is on a massive bullish move as it is up by almost 16.83% at the time of writing this post. The 24h High is $6.4802 and 24h Low is $5.3610.
The price for EOS is on the bullish move after the company announced on 27th August that the developers are “building a voting system to help with the decision making” for the platform’s $35 million savings account.
EOS Price Prediction and Technical Analysis
As EOS is currently trading at $6.35 USD (16.83%) as per Coinmarketcap while writing this post. Now let’s discuss the price prediction and technical analysis on the basis of the 1-day price forecast. Later on, I’ll do the technical analysis on the basis of 1h price forecast.
The 10-day Exponential Moving Average for EOS token is 5.4246 indicating a buy signal. Also the 10-day Simple Moving Average is 5.1867 indicating a buy signal. While looking at the 20-day EMA, 20-day SMA having values 5.4919 and 5.0635 respectively. Here the interesting part is that both the 20-day EMA and 20-day SMA is indicating a buy signal.
Binance
Now let’s have a look on the oscillators the Relative Strength Index (14) for EOS is 57.9469 which is in the Neutral zone. But while looking at the MACd Level (12, 27) its is -0.2672 having a buy signal.
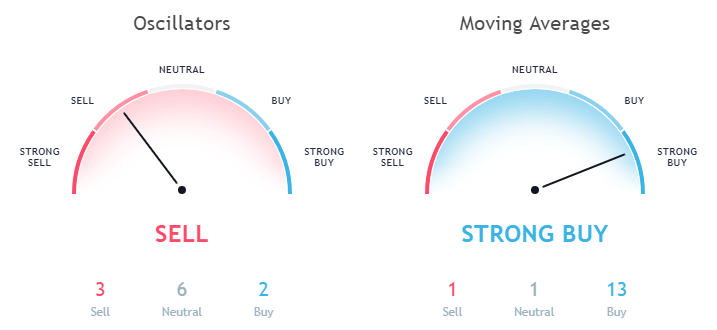
It’s time to discuss the technical analysis on the basis of 1h price forecast. In the 1h price forecast, the Exponential Moving Average (10) is 6.1470 and EMA (20) is 5.9781. Even also the Simple Moving Average (10) is 6.0994 and SMA (20) is 5.9778. Here all the EMA (10), EMA (20), SMA (10) and SMA (20) is recommending a buy signal.
Not even this the EMA (30), EMA (50), EMA (100) and EMA (200) is indicating a buy signal and similar is the case with the Simple Moving Average (SMA).
Data as per TradingView
But while looking at the Oscillators the Relative Strength Index (14) is 86.6529 indicating a sell signal. The good thing is that the MACD Level (12, 27) is 0.2103 indicating a buy signal.
This article should not be considered as an investment advice. Please conduct your own research before investing in any cryptocurrency.
Disclaimer: Koinalert’s content is only for information purpose in nature and should not be considered as investment advice. Do your own market research before investing in any cryptocurrencies. The author or publication does not hold any responsibility for your personal financial loss.
![Dogecoin [DOGE] Price Analysis Before and After Elon Musk SNL Tweet](https://www.koinalert.com/wp-content/uploads/2021/05/Dogecoin-price-analysis-after-Elon-Musk-SNL-tweet-400x240.jpg)
![Dogecoin [DOGE] Price Analysis Before and After Elon Musk SNL Tweet](https://www.koinalert.com/wp-content/uploads/2021/05/Dogecoin-price-analysis-after-Elon-Musk-SNL-tweet-80x80.jpg)


iGaming Platform BC.GAME Signs $40 Million Deal to Become Principal Partner of Leicester City

Coinbase faces new lawsuit that claims SOL, MATIC, NEAR, MANA, ALGO, UNI, XTZ and XLM are securities

Service Beyond Gaming: The Support Experience at HugeWin

Bitcoin (BTC) Cycle: Aiming for $155,000 Peak by August 2025
