
Price Analysis
Ripple [XRP] Price Prediction, Technical Analysis – October 2nd
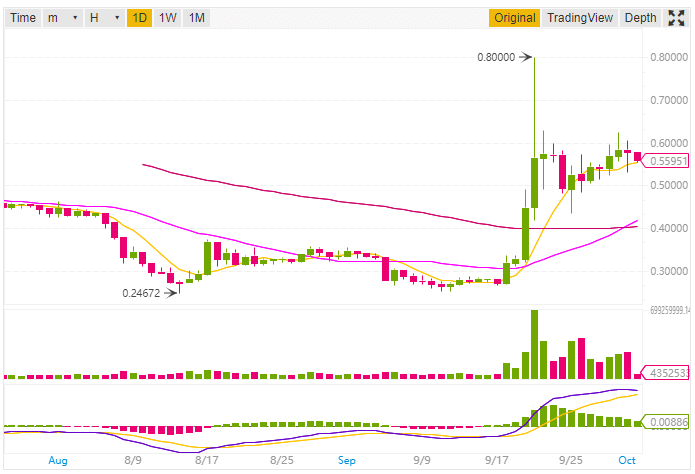
Ripple XRP is the 3rd largest cryptocurrencies by Market Capitalization is currently trading at $0.565464 USD (-2.77%) according to CoinMarketCap at the time of writing this post. The 24h High for this cryptocurrency is $0.53534 and 24h Low is $0.53200 (As per Binance XRP/USDT pair). The market capitalization for Ripple XRP while writing this post is $22,582,042,562 USD (CoinMarketCap).
Ripple NEWS
As you know Swell by Ripple is going on at San Francisco, CA where many big personalities have participated. Renowned economist Susan Athey, at the Swell event, stated that Ripple stands out in its solution to real-world problems.
Also, Garlinghouse concluded, “We’re only as good as our ability to solve our customers’ problems. And the work partners like MercuryFX, Cuallix, and Catalyst Corporate Federal Credit Union are doing with xRapid has demonstrated that we’re solving a real problem.”
Ripple Price Prediction and Technical Analysis
We will do the analysis in two parts, the first will be based on 1-day price forecast while the other will be 1h price forecast. Here all the technical analysis will be based on Moving averages and Oscillators.
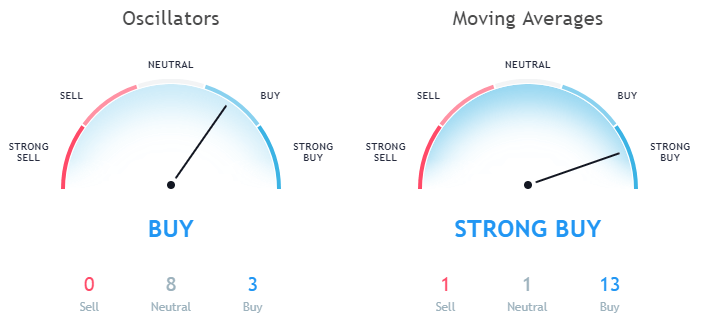
1-day Price Forecast
In the 1-day price forecast, the Exponential Moving Average (10) is 0.53699 and Simple Moving Averages is 0.54779 both indicating a buy signal. Rest other EMA and SMA like EMA (20, 30, 50, 100, 200) and SMA (20, 30, 50, 100, 200) are also in the buy zone.
Data as per Binance
However, the Hull Moving Average (9) which is 0.58729 is indicating a sell signal. The Ichimoku Cloud Base Line (9, 26, 52, 26) is 0.52172 and is in the neutral zone. It seems that almost all the Moving Averages are towards buy zone.
Data as per TradingView
Let’s have a look at the Oscillators, the Relative Strength Index (14) is 68.04716 and the MACD Level (12, 27) is 0.06580 and is recommending buying. The Average Directional Index (14) is in the Neutral zone having a value of 42.70705 and the Stochastic %K (14, 3, 3) is in the Neutral Zone.
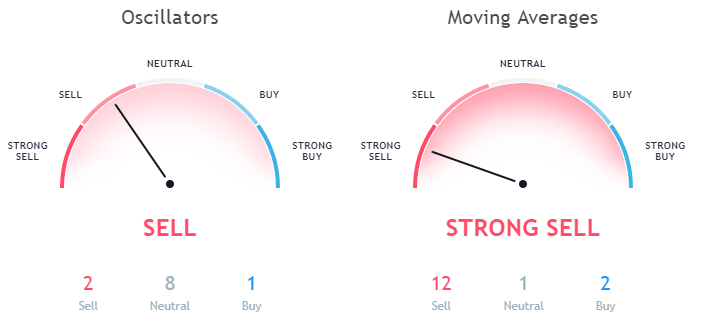
1h Price Forecast
Now let’s discuss the price forecast based on 1-hour price graph. While looking at the Moving Averages of 1h price graph the Exponential Moving Average (10) is 0.56944 and Simple Moving Average (10) is 0.57191. Here both the EMA (10) and SMA (10) is in a sell zone.
Even all other EMA (20, 30, 50, 100) and SMA (20, 30, 50, 100) are in the massive sell zone. The only moving average in the buy zone is EMA (200) and SMA (200). Here it seems that Ripple XRP is in a massive bearish move in the 1-hour price forecast.
Data as per TradingView
The Ichimoku Cloud Base Line (9, 26, 52, 26) is 0.56359 and is in the Neutral zone.
Now let’s have a look at the Oscillators the Relative Strength Index (14) in the 1h forecast is 43.57770 which is in the neutral zone. The MACD level (12, 27) is -0.00160 indicating a sell signal. The Awesome Oscillator having a value of -0.00409 is in the sell zone and the Momentum (10) having value -0.02753 is in the buy zone.
This article should not be considered as an investment advice. Please conduct your own research before investing in any cryptocurrency.
Disclaimer: Koinalert’s content is only for information purpose in nature and should not be considered as investment advice. Do your own market research before investing in any cryptocurrencies. The author or publication does not hold any responsibility for your personal financial loss.


Service Beyond Gaming: The Support Experience at HugeWin

Bitcoin (BTC) Cycle: Aiming for $155,000 Peak by August 2025

Alchemy Pay and Astar Network collaborate to integrate Astar zkEVM & its native token ASTR
Bitcoin (BTC) Price Plunges after an All-Time High Above $69K