
Price Analysis
Ripple [XRP] Price Prediction, Technical Analysis – October 1st
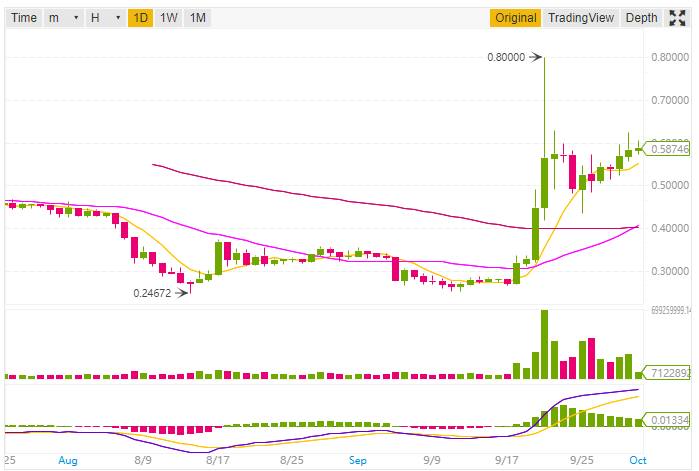
Ripple XRP is the 3rd largest cryptocurrencies by Market Capitalization is currently trading at $0.586844 USD (-2.40%) according to CoinMarketCap at the time of writing this post. The 24h High for this cryptocurrency is $0.62604 and 24h Low is $0.55744 (As per Binance XRP/USDT pair). The market capitalization for Ripple XRP while writing this post is $23,398,018,899 USD (CoinMarketCap).
Ripple NEWS
Today is 1st of October 2018 and as per the schedule Swell event will start at 07:00 AM. “Swell, hosted by Ripple, connects the world’s leading experts on policy, payments, and technology for the most provocative dialogue in global payments today.” The keynote speaker is President Bill Clinton.
Ripple Price Prediction and Technical Analysis
We will do the analysis in two parts, the first will be based on 1-day price forecast while the other will be 1h price forecast. Here all the technical analysis will be based on Moving averages and Oscillators.
1-day Price Forecast
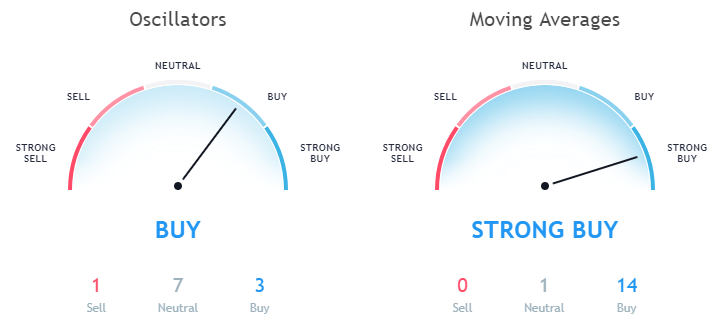
In the 1-day price forecast, the Exponential Moving Average (10) is 0.53336 and Simple Moving Averages is 0.55010 both indicating a buy signal. Rest other EMA and SMA like EMA (20, 30, 50, 100, 200) and SMA (20, 30, 50, 100, 200) are also in the buy zone.
Data as per Binance
However, one of the moving averages which is Ichimoku Cloud Base Line (9, 26, 52, 26) which is 0.52172 is in the neutral zone.
Data as per TradingView
While looking at the Oscillators the Relative Strength Index (14) is 72.79440 which is in the Sell Zone and the MACD Level (12, 27) is 0.06811 and is recommending buying. Momentum (10) is also in the buying zone having a value of 0.02547
The Bull Bear Power for XRP is 0.15269 which is in the Neutral zone.
1h Price Forecast
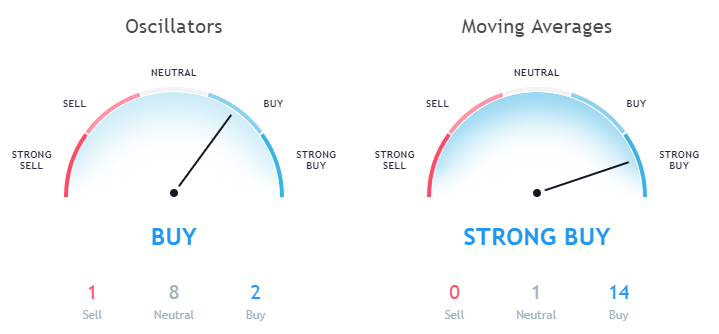
Now let’s discuss the price forecast based on 1-hour price graph. While looking at the Moving Averages of 1h price graph the Exponential Moving Average (10) is 0.58573 and Simple Moving Average (10) is 0.58640. Here both the EMA (10) and SMA (10) is in a buy zone.
Data as per TradingView
The only moving average which is in the neutral zone is Ichimoku Cloud Base Line (9, 26, 52, 26) having a value of 0.59157.
Also, while looking at the Oscillators the Relative Strength Index (14) in the 1h forecast is 54.23295 which is in the neutral zone. The MACD level (12, 27) is 0.00157 indicating a sell signal. The Awesome Oscillator having a value of -0.00292 is in the neutral zone and the Momentum (10) having value -0.00383 is in the buy zone.
This article should not be considered as an investment advice. Please conduct your own research before investing in any cryptocurrency.
Disclaimer: Koinalert’s content is only for information purpose in nature and should not be considered as investment advice. Do your own market research before investing in any cryptocurrencies. The author or publication does not hold any responsibility for your personal financial loss.


iGaming Platform BC.GAME Signs $40 Million Deal to Become Principal Partner of Leicester City

Coinbase faces new lawsuit that claims SOL, MATIC, NEAR, MANA, ALGO, UNI, XTZ and XLM are securities

Service Beyond Gaming: The Support Experience at HugeWin

Bitcoin (BTC) Cycle: Aiming for $155,000 Peak by August 2025
