
Price Analysis
Ripple [XRP] Price Prediction, Technical Analysis – September 30th
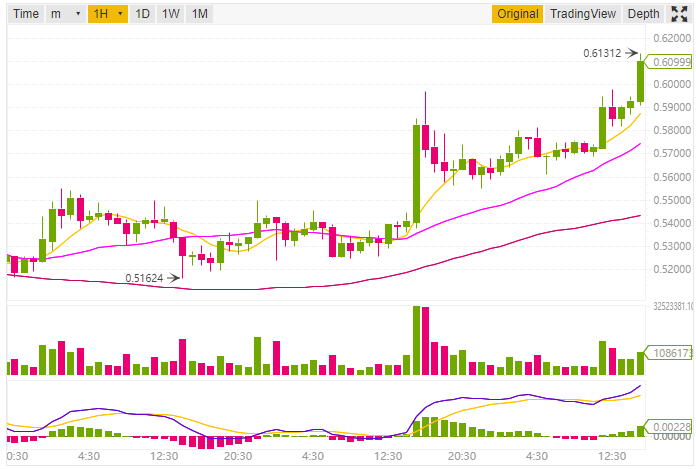
Ripple XRP is the 3rd largest cryptocurrencies by Market Capitalization is currently trading at $0.591746 USD (+7.54%) according to CoinMarketCap at the time of writing this post. The 24h High for this cryptocurrency is $0.61312 and 24h Low is $0.54050 (As per Binance XRP/USDT pair). The market capitalization for Ripple XRP while writing this post is $23,593,438,245 USD (CoinMarketCap).
Ripple NEWS
As you know Ripple is going to host an event at San Francisco, CA on October 1-2, 2018. As per the official website “Swell, hosted by Ripple, connects the world’s leading experts on policy, payments, and technology for the most provocative dialogue in global payments today.” The keynote speaker is President Bill Clinton.
As said in the previous day prediction that there will be a bull run before the start of the event and it seems that bull run has started. The Ripple XRP price has crossed the $0.60 mark.
Ripple Price Prediction and Technical Analysis
We will do the analysis in two parts, the first will be based on 1-day price forecast while the other will be 1h price forecast.
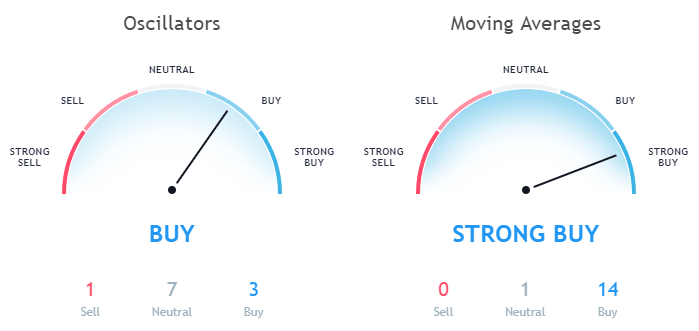
1-day Price Forecast
The 1-day price analysis will be based on the Moving averages and Oscillators. After seeing the moving averages the Exponential Moving Average (10) is 0.52601 while Simple Moving Average is 0.55048. Other moving averages like EMA (20, 30, 50, 100, 200) and SMA (20, 30, 50, 100, 200) all are in the massive buy zone. However, one of the moving averages which is Ichimoku Cloud Base Line (9, 26, 52, 26) is in the neutral zone.
Data as per Binance
Volume Weighted Moving Average (20) for Ripple XRP is 0.49878 indicating a buy signal. The Hull Moving Average (9) is also in the buy zone with a value of 0.57557
Data as per TradingView
While looking at the Oscillators the Relative Strength Index (14) is 74.23724 which is in the Sell Zone and the MACD Level (12, 27) is 0.06868 and recommending buying. Momentum (10) is also in the buying zone having a value of 0.16304
The Bull Bear Power for XRP is 0.16639 which is in the Neutral zone.
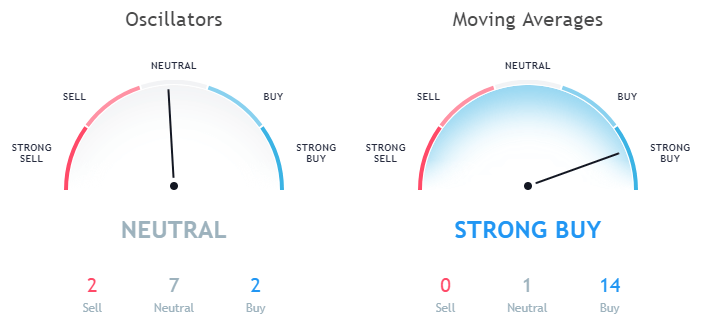
1h Price Forecast
Now let’s discuss the price forecast based on 1-hour price graph. While looking at the Moving Averages of 1h price graph the Exponential Moving Average (10) is 0.58710 and Simple Moving Average (10) is 0.58313. Here both the EMA (10) and SMA (10) is indicating a buy signal. Here also all other moving averages like EMA (20, 30, 50, 100, 200) and SMA (20, 30, 50, 100, 200) are in the buy zone.
Data as per TradingView
The only moving average which is in the neutral zone is Ichimoku Cloud Base Line (9, 26, 52, 26) having a value of 0.57722.
Also, while looking at the Oscillators the Relative Strength Index (14) in the 1h forecast is 76.39332 which is in the sell zone. The MACD level (12, 27) is 0.01183 indicating a buy signal. The Awesome Oscillator having a value of 0.02850 is in the buy zone and the Momentum (10) having value 0.04566 is in the sell zone.
This article should not be considered as an investment advice. Please conduct your own research before investing in any cryptocurrency.
Disclaimer: Koinalert’s content is only for information purpose in nature and should not be considered as investment advice. Do your own market research before investing in any cryptocurrencies. The author or publication does not hold any responsibility for your personal financial loss.


iGaming Platform BC.GAME Signs $40 Million Deal to Become Principal Partner of Leicester City

Coinbase faces new lawsuit that claims SOL, MATIC, NEAR, MANA, ALGO, UNI, XTZ and XLM are securities

Service Beyond Gaming: The Support Experience at HugeWin

Bitcoin (BTC) Cycle: Aiming for $155,000 Peak by August 2025
