
Price Analysis
Ethereum [ETH] Price Prediction, Technical Analysis – September 29th
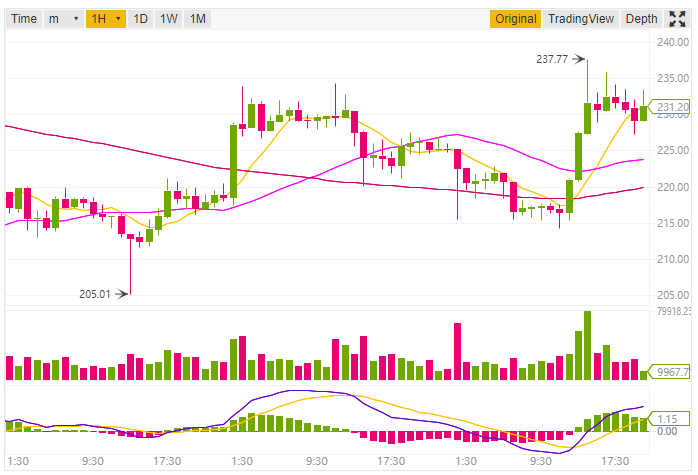
Ethereum [ETH] the 2nd largest cryptocurrency by market capitalization is trading at $230.34 USD (+1.93%). The market capitalization at the time of writing this post is $23,555,199,543 USD as per Coinmarketcap. The 24h high for ETH is 237.77 and 24h low for ETH is 214.18
According to Fundstrat head of research, Tom Lee the price of Ethereum will be $1900 by the end of the year 2019. This price of Ethereum ETH is almost 40 times high than the price of Ethereum’s all-time high of $1,349
Ethereum Price Prediction and Technical Analysis
Here we will do the analysis based on 1-day and 1h price forecast. So let’s start the analysis based on SMA, EMA, MACD Level, RSI, and other technicals.
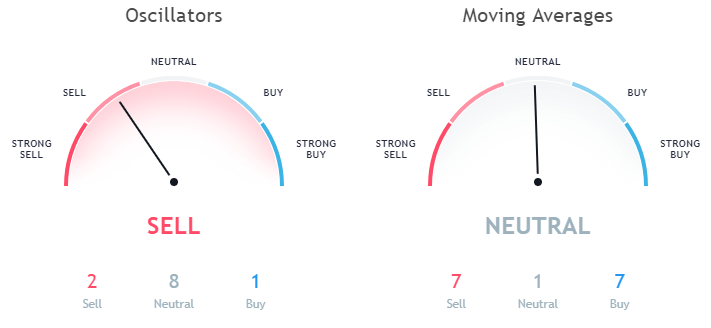
1-day Price Forecast
The 10-day Exponential Moving Average is 225.74 and 10-day Simple Moving Average is 230.29. Both the EMA (10) and SMA (10) is indicating a buy signal. Also, the EMA (20) and SMA (20) is indicating towards a buy signal. But while looking at the EMA (50, 100, 200) and SMA (50, 100, 200), these are still to be achieved.
Data as per Binance
The Volume Weighted Moving Average (20) for ETH is 214.28 and the Hull Moving Average (9) is 221.78. Here both of these are indicating a buy signal.
Data as per Binance
Let’s have a look at the Oscillators the Relative Strength Index (14) is 49.04 which is in the Neutral zone and the MACD Level (12, 27) is -7.93 indicating a buying signal. The Momentum (10) is indicating towards selling with a value of 22.05
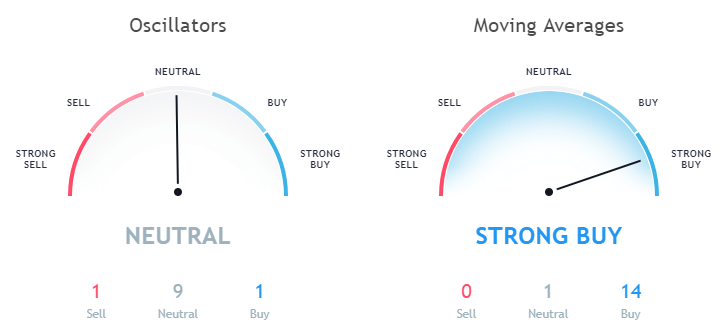
1-h Price Forecast
The Exponential Moving Average (10) is 228.49 while Simple Moving Average (10) is 228.23 both of them depicting buying. Not only this all other EMA (20, 30, 50) and SMA (20, 30, 50) indicating towards buying.
Data as per Binance
Now let’s have a look at the oscillators, the Relative Strength Index (14) is 64.88 and is currently in the Neutral Zone. The MACD Level (12, 27) is 2.29 indicating a buy signal. The Momentum (10) which is 15.33 depicting towards selling.
This article should not be considered as an investment advice. Please conduct your own research before investing in any cryptocurrency.
Disclaimer: Koinalert’s content is only for information purpose in nature and should not be considered as investment advice. Do your own market research before investing in any cryptocurrencies. The author or publication does not hold any responsibility for your personal financial loss.


iGaming Platform BC.GAME Signs $40 Million Deal to Become Principal Partner of Leicester City

Coinbase faces new lawsuit that claims SOL, MATIC, NEAR, MANA, ALGO, UNI, XTZ and XLM are securities

Service Beyond Gaming: The Support Experience at HugeWin

Bitcoin (BTC) Cycle: Aiming for $155,000 Peak by August 2025
