
Price Analysis
Ripple [XRP] Price Prediction, Technical Analysis – October 14th
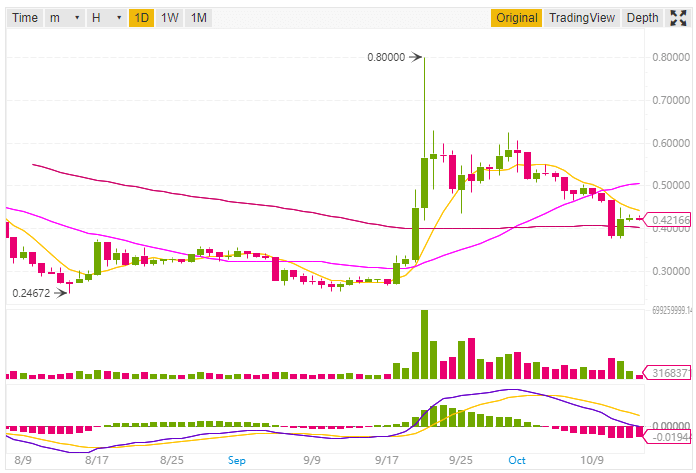
Ripple is continuously losing its value against the dollar this week. Ripple XRP currently at the number 3rd in terms of market capitalization is trading at $0.419792 USD (-0.73%).
This week the value of Ripple has gone below its 200-day EMA. The 200-day Exponential Moving Average for XRP is 0.50588 while the 200-day SMA is 0.51974.
In the previous week, the price of Ripple was above the 200-day EMA and SMA. This surge in the price of XRP was due to the Swell event by Ripple. However, after the Swell event, the price begins to fall continuously.
If we look at % 7d then we find that this week XRP has the downfall of about -11.60%. The daily Volume Weighted Moving Average (20) for Ripple XRP is 0.51308 indicating towards a sell signal. But the Hull Moving Average (9) is indicating a buy signal with a value of 0.39704.
Ripple Price Prediction and Technical Analysis
We will do the analysis in two parts, the first will be based on 1-day price forecast while the other will be 1h price forecast.
1-day Price Forecast
In the 1-day price analysis, almost all the moving averages are towards a sell signal. Ripple XRP has gone below the 10-day Exponential Moving Average and Simple Moving Average. The EMA (10) is 0.45208 while SMA (10) is 0.45827, both towards sell signal.
Data as per Binance
Let’s have a look at the Oscillators, the Relative Strength Index (14) is 44.06249 which is in the neutral zone. Also, the MACD Level (12, 27) is -0.00031 which is towards sell.
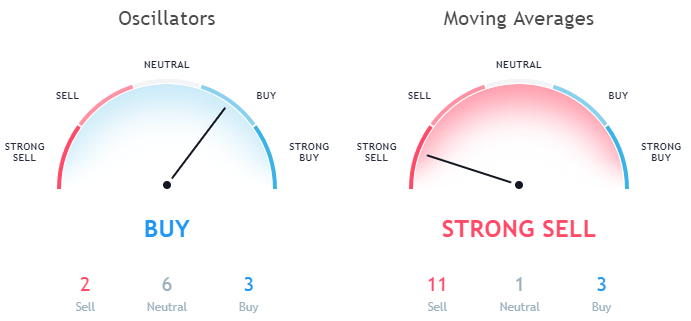
Data as per TradingView
The Bull Bear Power is -0.06854 which is in the neutral zone.
1h Price Forecast
Now let’s discuss the price forecast based on 1-hour price graph. While looking at the Moving Averages of 1h price graph the Exponential Moving Average (10) is 0.42426 and Simple Moving Average (10) is 0.42502. Here both the EMA (10) and SMA (10) is indicating a sell signal.
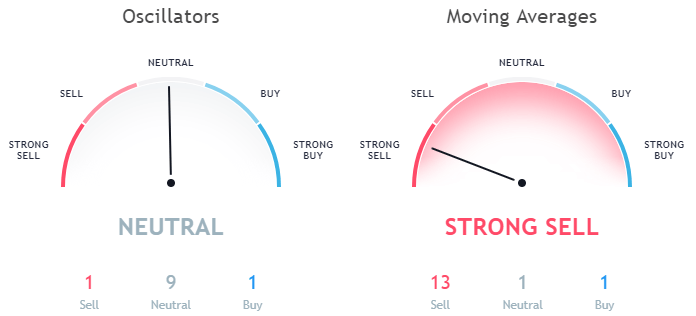
Data as per TradingView
Not only this all other EMA (20, 30, 50, 100, 200) and SMA (20, 30, 50, 100, 200) is indicating towards a massive sell signal. The only moving average which is in the neutral zone is Ichimoku Cloud Base Line (9, 26, 52, 26) having a value of 0.42435.
Also, while looking at the Oscillators the Relative Strength Index (14) in the 1h forecast is 47.68758 which is in the neutral zone. The MACD level (12, 27) is 0.00054 indicating a buy signal. The Awesome Oscillator having a value of 0.00190 is in the neutral zone.
Conclusion
If the bear breaks the Ripple XRP price of October 11th then there are more chances that it will go below $0.30. However, if you want to HODL then you can buy it now and HODL it for a long time to have a big profit.
This article should not be considered as an investment advice. Please conduct your own research before investing in any cryptocurrency.
Disclaimer: Koinalert’s content is only for information purpose in nature and should not be considered as investment advice. Do your own market research before investing in any cryptocurrencies. The author or publication does not hold any responsibility for your personal financial loss.


iGaming Platform BC.GAME Signs $40 Million Deal to Become Principal Partner of Leicester City

Coinbase faces new lawsuit that claims SOL, MATIC, NEAR, MANA, ALGO, UNI, XTZ and XLM are securities

Service Beyond Gaming: The Support Experience at HugeWin

Bitcoin (BTC) Cycle: Aiming for $155,000 Peak by August 2025
