
Price Analysis
Tron [TRX] Price Prediction, Technical Analysis – October 15th

Tron TRX the 11th largest cryptocurrency by Market Capitalization today seems to be in a bullish move. As you know TRON is consistent from a long time at $0.01 – $0.02. Currently, TRX is trading at $0.025333 USD (+5.09%) as per CoinMarketCap while writing this post.
It sounds that Tron seems to be healthy as it’s in the green zone. The market capitalization of TRON at the time of writing this post is $1,665,589,906 USD.
The surge in the price of TRX started after Justin Sun tweets
“Finally, First time to partner with tens of billions USD valuation industry giant. Guess the name #TRON #TRX $TRX”
Tron Price Prediction and Technical Analysis
Let’s have a look at the price analysis based on EMA, SMA, RSI, MACD Level etc. We will do the price analysis based on 1-day and 1-hour price of TRX.
1-day Price Forecast
The 10-day Exponential Moving Average for Tron TRX is 0.024215 while the 10-day Simple Moving Average is 0.024682. It seems that TRX has broken the 10 days EMA and SMA.
Data as per Binance
However, the Volume Weighted Moving Average (20) is 0.023727 and the Hull Moving Average (9) is 0.023744. Here both of these data is showing a buy signal.
Data as per TradingView
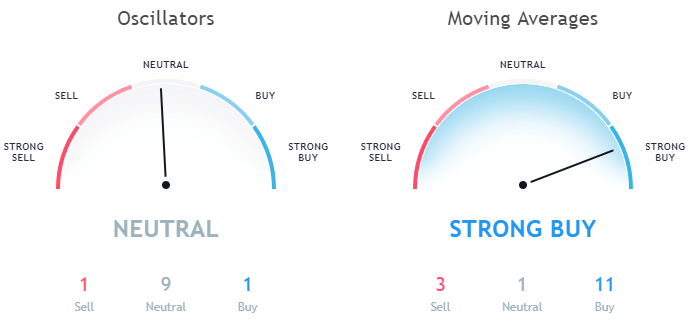
Let’s have a look at the Oscillators, the MACD Level (12, 27) is 0.000682 indicating a buy signal. The Relative Strength Index (14) is 59.438970 which is in the Neutral zone. Also, the Bull Bear Power is 0.002802 which is in the neutral zone.
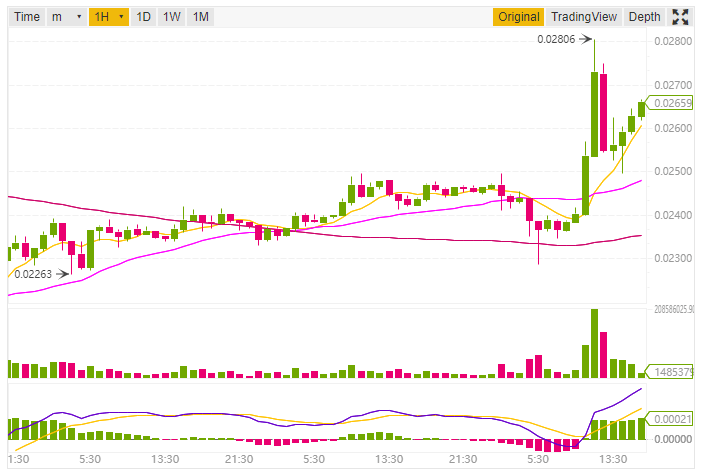
1h Price Forecast
Now let’s have a look at the 1h price forecast. The Exponential Moving Average (10) for Tron TRX is 0.025501 while the Simple Moving Average (10) is 0.025310. Here both EMA (10) and SMA (10) is indicating a buy signal.
Data as per TradingView
The Hull Moving Average (9) with a value of 0.026159 is in the buy zone.
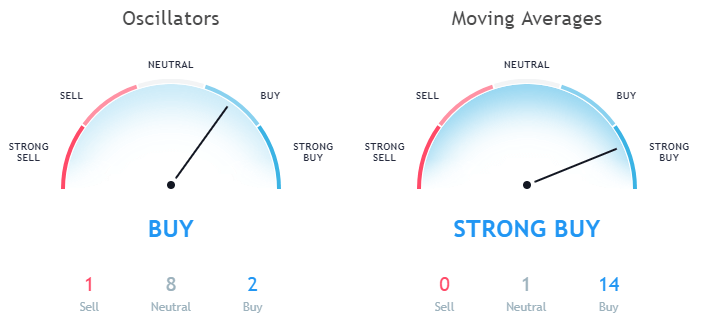
Even if we look at the Oscillators for 1h price forecast the Relative Strength Index (14) is 62.024710 which is in the neutral zone. The MACD Level (12, 27) is in the buy zone with a value of 0.000491.
Conclusion
As per the analysis, the price of Tron TRX will hold at 0.026101 which is daily SMA (100). If it breaks the daily EMA (100) then there is a chance that Tron price will surge more and might cross daily EMA (200).
This article should not be considered as an investment advice. Please conduct your own research before investing in any cryptocurrency.
Disclaimer: Koinalert’s content is only for information purpose in nature and should not be considered as investment advice. Do your own market research before investing in any cryptocurrencies. The author or publication does not hold any responsibility for your personal financial loss.


iGaming Platform BC.GAME Signs $40 Million Deal to Become Principal Partner of Leicester City

Coinbase faces new lawsuit that claims SOL, MATIC, NEAR, MANA, ALGO, UNI, XTZ and XLM are securities

Service Beyond Gaming: The Support Experience at HugeWin

Bitcoin (BTC) Cycle: Aiming for $155,000 Peak by August 2025
