
Cryptocurrency News
What Are the Quality Cryptocurrency Analysis Tools?
Traders who invest in cryptocurrencies and other digital assets would have to learn to analyze the specific performance of these securities in the market. Most crypto projects provide users with sufficient information through white papers, communities, and websites to enable investors to make informed investment decisions. Investors typically use both quantitative and qualitative methods to assess the growth potential of cryptocurrencies. This article will explain how investors can use fundamental analysis to assess the value of cryptocurrencies.
What is Fundamental Analysis?
Fundamental analysis is a process of evaluating the intrinsic value of cryptocurrencies in order to determine whether they are overvalued or undervalued. In other words, fundamental analysis is a method used to determine the true value of an asset and usually includes an analysis of internal and external factors that affect the price of the asset.
Crypto appraisers will use cryptocurrency analytics tools to determine the true value of these digital assets. Some of the more popular crypto analytics tools available today include Market Value to Realized Value (MVRV), Network Value to Actual On-Chain Transaction Volume (NVT), and Inventory Flow Ratio. These on-chain metrics can be used to gauge the true sentiment of the cryptocurrency market.
Key Fundamental Analysis (FA) Indicators
As previously outlined, cryptocurrency fundamental analysts will use cryptocurrency analysis tools to analyze these digital assets. These metrics allow us to understand the market movement of cryptocurrencies before we buy them. The Market Value to Realized Value (MVRV), Network Value to Actual On-Chain Transaction Volume (NVT), and Inventory Flow Ratio are described below.
Market Value to Realized Value Ratio (MVRV)
The market value to realized value ratio is the ratio of the market value of a cryptocurrency to its realized value. The market value of an asset is usually calculated by multiplying the total outstanding supply of the asset by its current market price.
On the other hand, the realized value is calculated by multiplying each coin by the price at the time of the last move. In addition, it has become possible to calculate the realized value using suitable data such as Bitcoin’s UTXO technology. This realized value, also known as realized capitalization, is a better way to measure the value of cryptocurrencies because it uses the true price of each coin at the time of movement.
MVRV = Market Capitalization / Realized Market Capitalization
If MVRV is higher than 1, it indicates that the cryptocurrency is overvalued.
In general, if the MVRV value is high, it indicates that the current market price is higher than the value of the cryptocurrency at the time the investor purchased it, signaling that the investor may sell the token or coin for a profit in the near future. Conversely, if the MVRV value is low, it indicates that investors may hold the coin and wait for its value to rise.
Network Value to Actual On-Chain Transaction Volume (NVT) Ratio
Naturally, the network value to actual on-chain transaction volume (NVT) ratio is also one of the useful metrics for crypto trading. This on-chain analysis tool is similar to the price ratio (P/E) used in traditional finance when dealing with stocks.
We typically obtain the NVT ratio by dividing the market capitalization of an asset by the daily trading volume that reflects the intrinsic value of the cryptocurrency. This metric has multiple implications for traders and other investors.
For example, if the price of a cryptocurrency rises despite no volume support, the currency may be entering bubble territory. In broad terms, a price bubble is possible if the NTV ratio is 90-95 or above. This is because the price of the cryptocurrency is rising while its potential value remains unchanged.
A low NVT ratio indicates that the asset is undervalued and thus shows bearish momentum. On the other hand, if the NVT ratio is constant, it indicates a better balance between the change in the growth of the asset and the volume of its transfer.
Inventory Flow Ratio
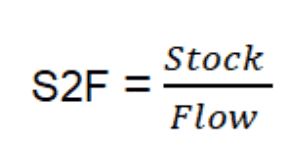
The Inventory Flow Ratio is another top crypto analysis tool that helps traders understand how to interpret cryptocurrency prices. However, this is an indicator used for cryptocurrencies with limited supply such as Bitcoin. It treats such cryptocurrencies as a fixed and scarce resource, similar to precious minerals such as gold and diamonds.
The inventory flow ratio shows how the new supply of an asset changes over a specific period (e.g., one year) and indicates the length of time it takes to produce the current revolving supply.
Bitcoin is a typical example of a fixed supply, with a fixed supply of 21 million coins. We can calculate the inventory flow ratio by dividing its circulating supply by the total number produced in a year. For bitcoin, we can calculate its annual production by the number of new bitcoins mined. We can use the following formula to calculate the inventory flow ratio for Bitcoin.
Assume that the estimated circulating supply is 19,000 and its annual emissions are about 328,500.
Then, the S2F value of Bitcoin = 19,000,000/328,500 = 57.84
High prices indicate that this commodity is very scarce. For example, the S2F value of Bitcoin indicates that it would take 57.84 years to produce 19 million Bitcoins at the current rate of output.
However, there will not be a constant stock ratio for Bitcoin, as Bitcoin halving occurs every time a miner adds 21,000 Bitcoins to the blockchain. Typically, a bitcoin halving occurs about once every four years. Analysts predict that 21,000 bitcoins will be produced again in 2140 as a result of the halving activity.
Examples of Crypto Fundamental Analysis Tools
Instead of manually calculating key fundamental analysis indicators, there are websites that publish these indicators. Some of the best sites for fundamental analysis include Baserank, Glassnode Studio, Coinigy, Gate.io, CoinMarketCal, Coin Metrics, Cryptovew.ch, and TradingView.
BaseRank: BaseRank is one of the largest sources of guide information for investing in cryptocurrencies, as it aggregates statistics and reviews from a wide range of professionals, including investors and experts in the crypto space. It provides practical information about teams, investment risks, and asset utilization. In addition, it provides a ranking of cryptocurrencies on a scale of 0 to 100 to guide investors in their investment decisions.
Crypto Fees: This site provides an overview of the transaction fees for different cryptocurrencies over the last 24 hours and 7 days. As we know, the network’s gas fee is a clear indicator of cryptocurrency demand. Relatively high transaction fees tend to indicate high demand for that asset.
Glassnode Studio: Most traders and investors use Glassnode Studio because it brings together essential data from a variety of sources, including trading and mining data, wallet holdings, and price information. As a result, it enables users to access multiple types of analytical information and use it to trade and make investment decisions.
Gate.io: This is actually a cryptocurrency exchange. It is recommended because this cryptocurrency exchange combines a lot of market analysis and the latest market trends. For example, there is a live cryptocurrency price update page, which can update the price trend of 1400+ tradable cryptocurrencies 24/7 in real time; there is also an academy and blog page, which will update the knowledge of newbies and popular market information; Moments is updated with the latest crypto market news, etc.
Coinigy: With Coinigy, you can use the APIs of different exchanges to create a single interface that combines the accounts of different wallets and exchanges. With this, you can integrate more than 40 cryptocurrency trading platforms including exchanges. Moreover, it helps you to trade on various trading platforms and use cryptocurrency graphical analysis.
Trading View: While traders can pay a subscription to access the data charts they want to know, they can also access free crypto chart indicators. In addition to benefiting from the charts, investors can get real market updates and enjoy other features. Traders and other investors can exchange information and watch live videos of experts and analysts in the forum. In general, the Trading View community helps most users to master key trading skills and knowledge.
Cryptowat.ch: Investors can access market information, including trading charts, from more than 24 major exchanges. Likewise, it aggregates numerous data from more than 4,000 online markets.
CoinMarketCal: Investors need to know some information in advance before investing in cryptocurrencies. For example, they need to be aware of the news about trends that affect the price of cryptocurrencies, and that’s where CoinMarketCal comes in. It provides users with important news and information to help them make important trading decisions. Users can also comment on some of this information.
Coin Metrics: Coin Metrics is a crypto analytics tool that supports both on-chain and off-chain, enabling researchers and analysts to understand the behavior and performance of the crypto market. It has a number of features to support the visualization of trends. It also has a variety of metrics and indices to show the latest developments and trends in the market.
CryptoView: CryptoView’s primary role is to display crypto assets in crypto exchanges, cold storage locations, and third-party digital wallets. It provides quantitative and qualitative data on many exchanges and can help investors keep up to date with the latest developments in the industry.
Conclusion
Traders and investors must understand the fundamentals of trading and how to interpret cryptocurrency prices in order to invest in profitable blockchain projects and cryptocurrencies. In addition to this, there are many cryptocurrency analysis tools and cryptocurrency trading indicators that investors can use to gain basic and in-depth knowledge related to their investments.
Disclaimer: Koinalert’s content is only for information purpose in nature and should not be considered as investment advice. Do your own market research before investing in any cryptocurrencies. The author or publication does not hold any responsibility for your personal financial loss.


iGaming Platform BC.GAME Signs $40 Million Deal to Become Principal Partner of Leicester City

Coinbase faces new lawsuit that claims SOL, MATIC, NEAR, MANA, ALGO, UNI, XTZ and XLM are securities

Service Beyond Gaming: The Support Experience at HugeWin

Bitcoin (BTC) Cycle: Aiming for $155,000 Peak by August 2025
